Why You Need Data Driven Decision Making
By Casey Ciniello
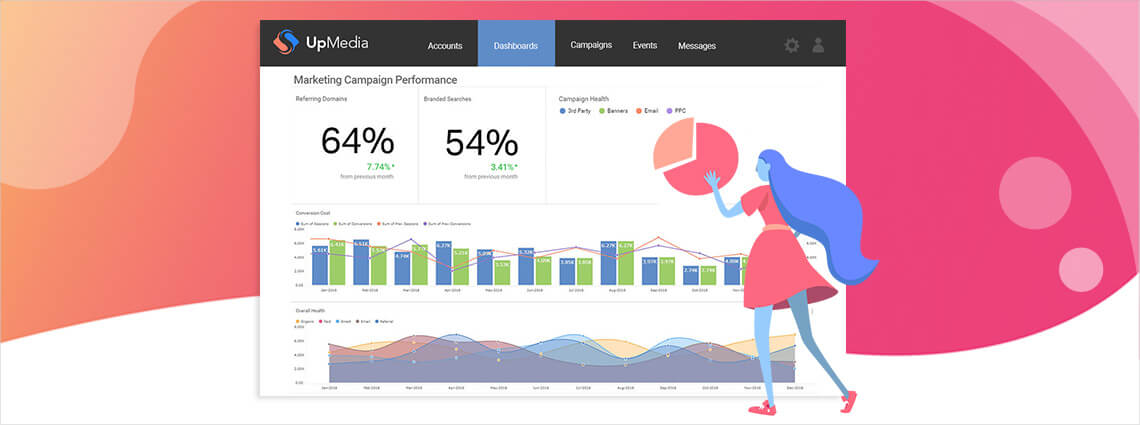
Find out what is data-driven decision making and why is important. Learn about the 7 building blocks for becoming a data-driven company + examples and video
Continue reading...Reveal business intelligence blog gives you the latest embedded analytics trends, how-tos, best practices, and product news.
Find out what is data-driven decision making and why is important. Learn about the 7 building blocks for becoming a data-driven company + examples and video
Continue reading...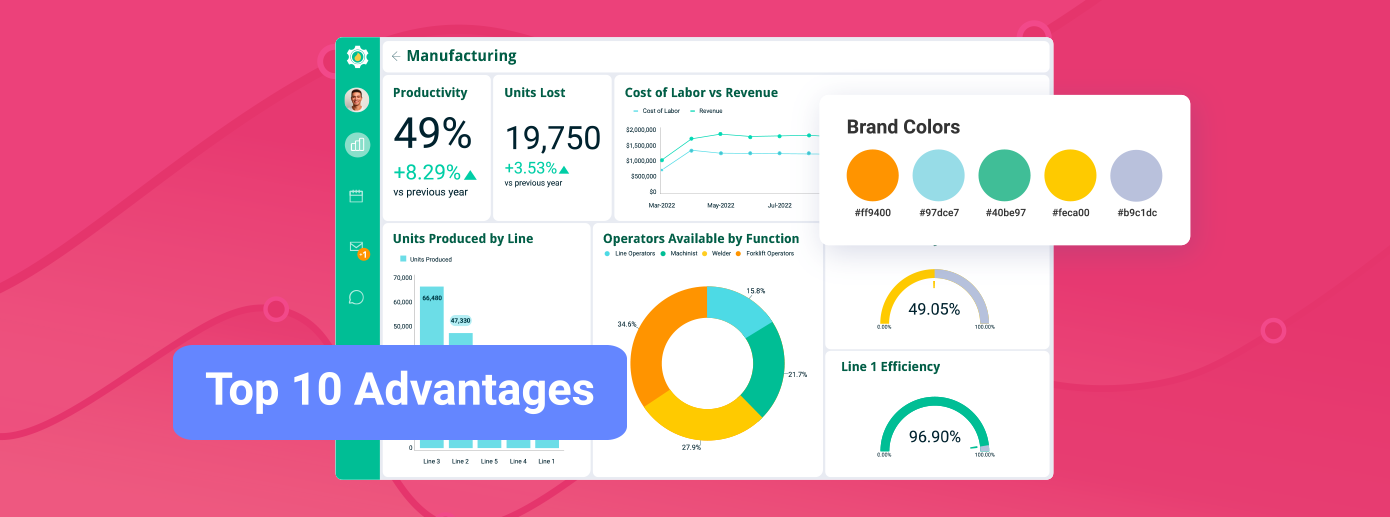
Learn how the top 10 embedded analytics benefits will enhance your decision making, streamline your workflow, and increase your product's value.
Continue reading...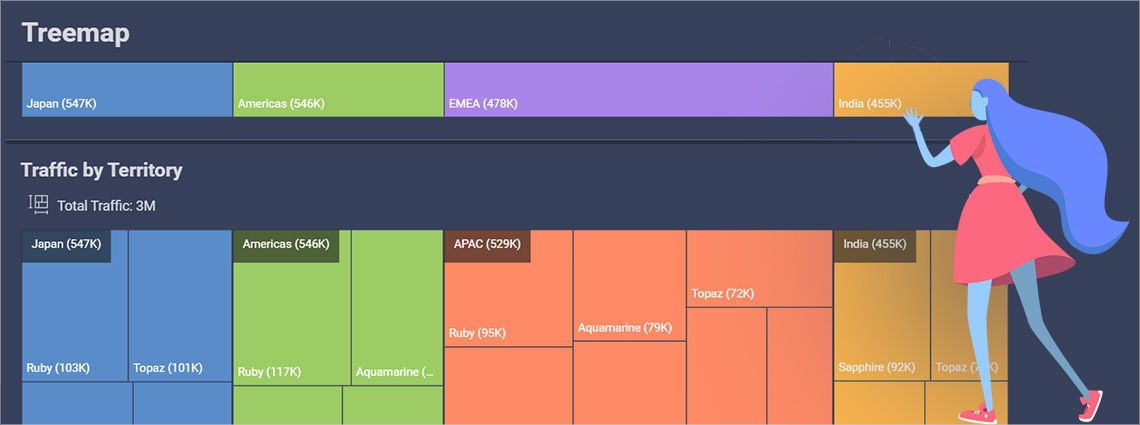
Treemap Chart Best Practices - Learn how to create Treemap Chart data visualizations using Reveal Embedded BI & Analytics.
Continue reading...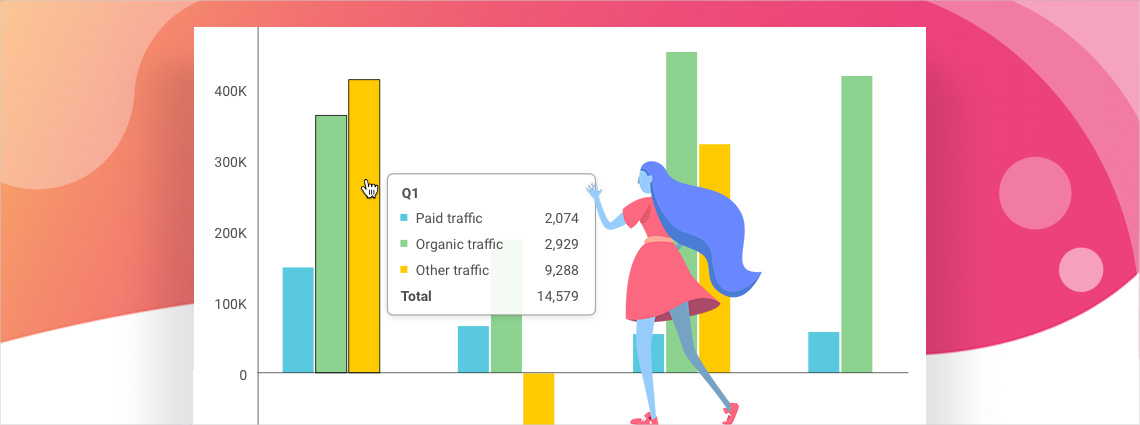
New features include additional flexibility in how to use Tooltips in visualizations, and theme updates to better match your application's look and feel.
Continue reading...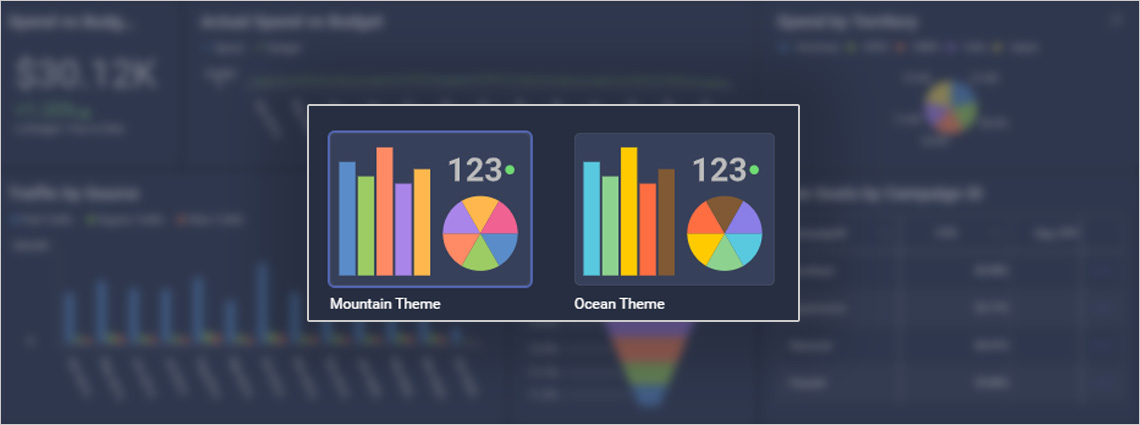
See how to apply custom theming to Reveal embedded BI software and create your own dashboard and visualization style to match your app's look and feel.
Continue reading...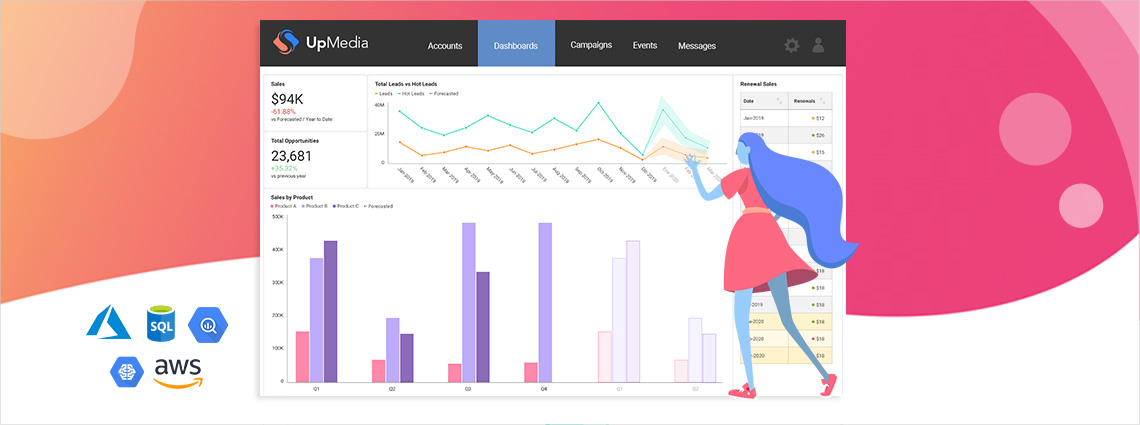
Experience the power of data analytics enhanced with machine learning, Big Data connectors, predictive analytics, R and Python scripting, and more.
Continue reading...Find out what is population pyramid chart and how to create one using stacked bar charts.
Continue reading...
In a recent podcast interview with SD Times, our Senior VP of Developer Tools, Jason Beres, talks about some of the key steps companies should consider as
Continue reading...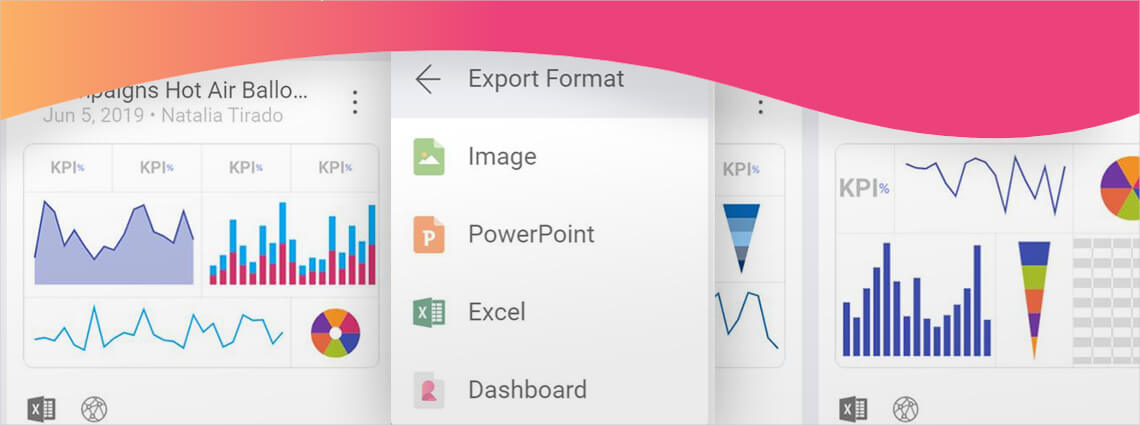
Enhance your embedded visualizations with the new combo charts with single or dual axis, work with a new modern UI, and export charts directly to Powerpoint or Excel.
Continue reading...
Use Reveal's in memory database feature to expand the number and types of data you can access from your app with embedded analytics.
Continue reading...