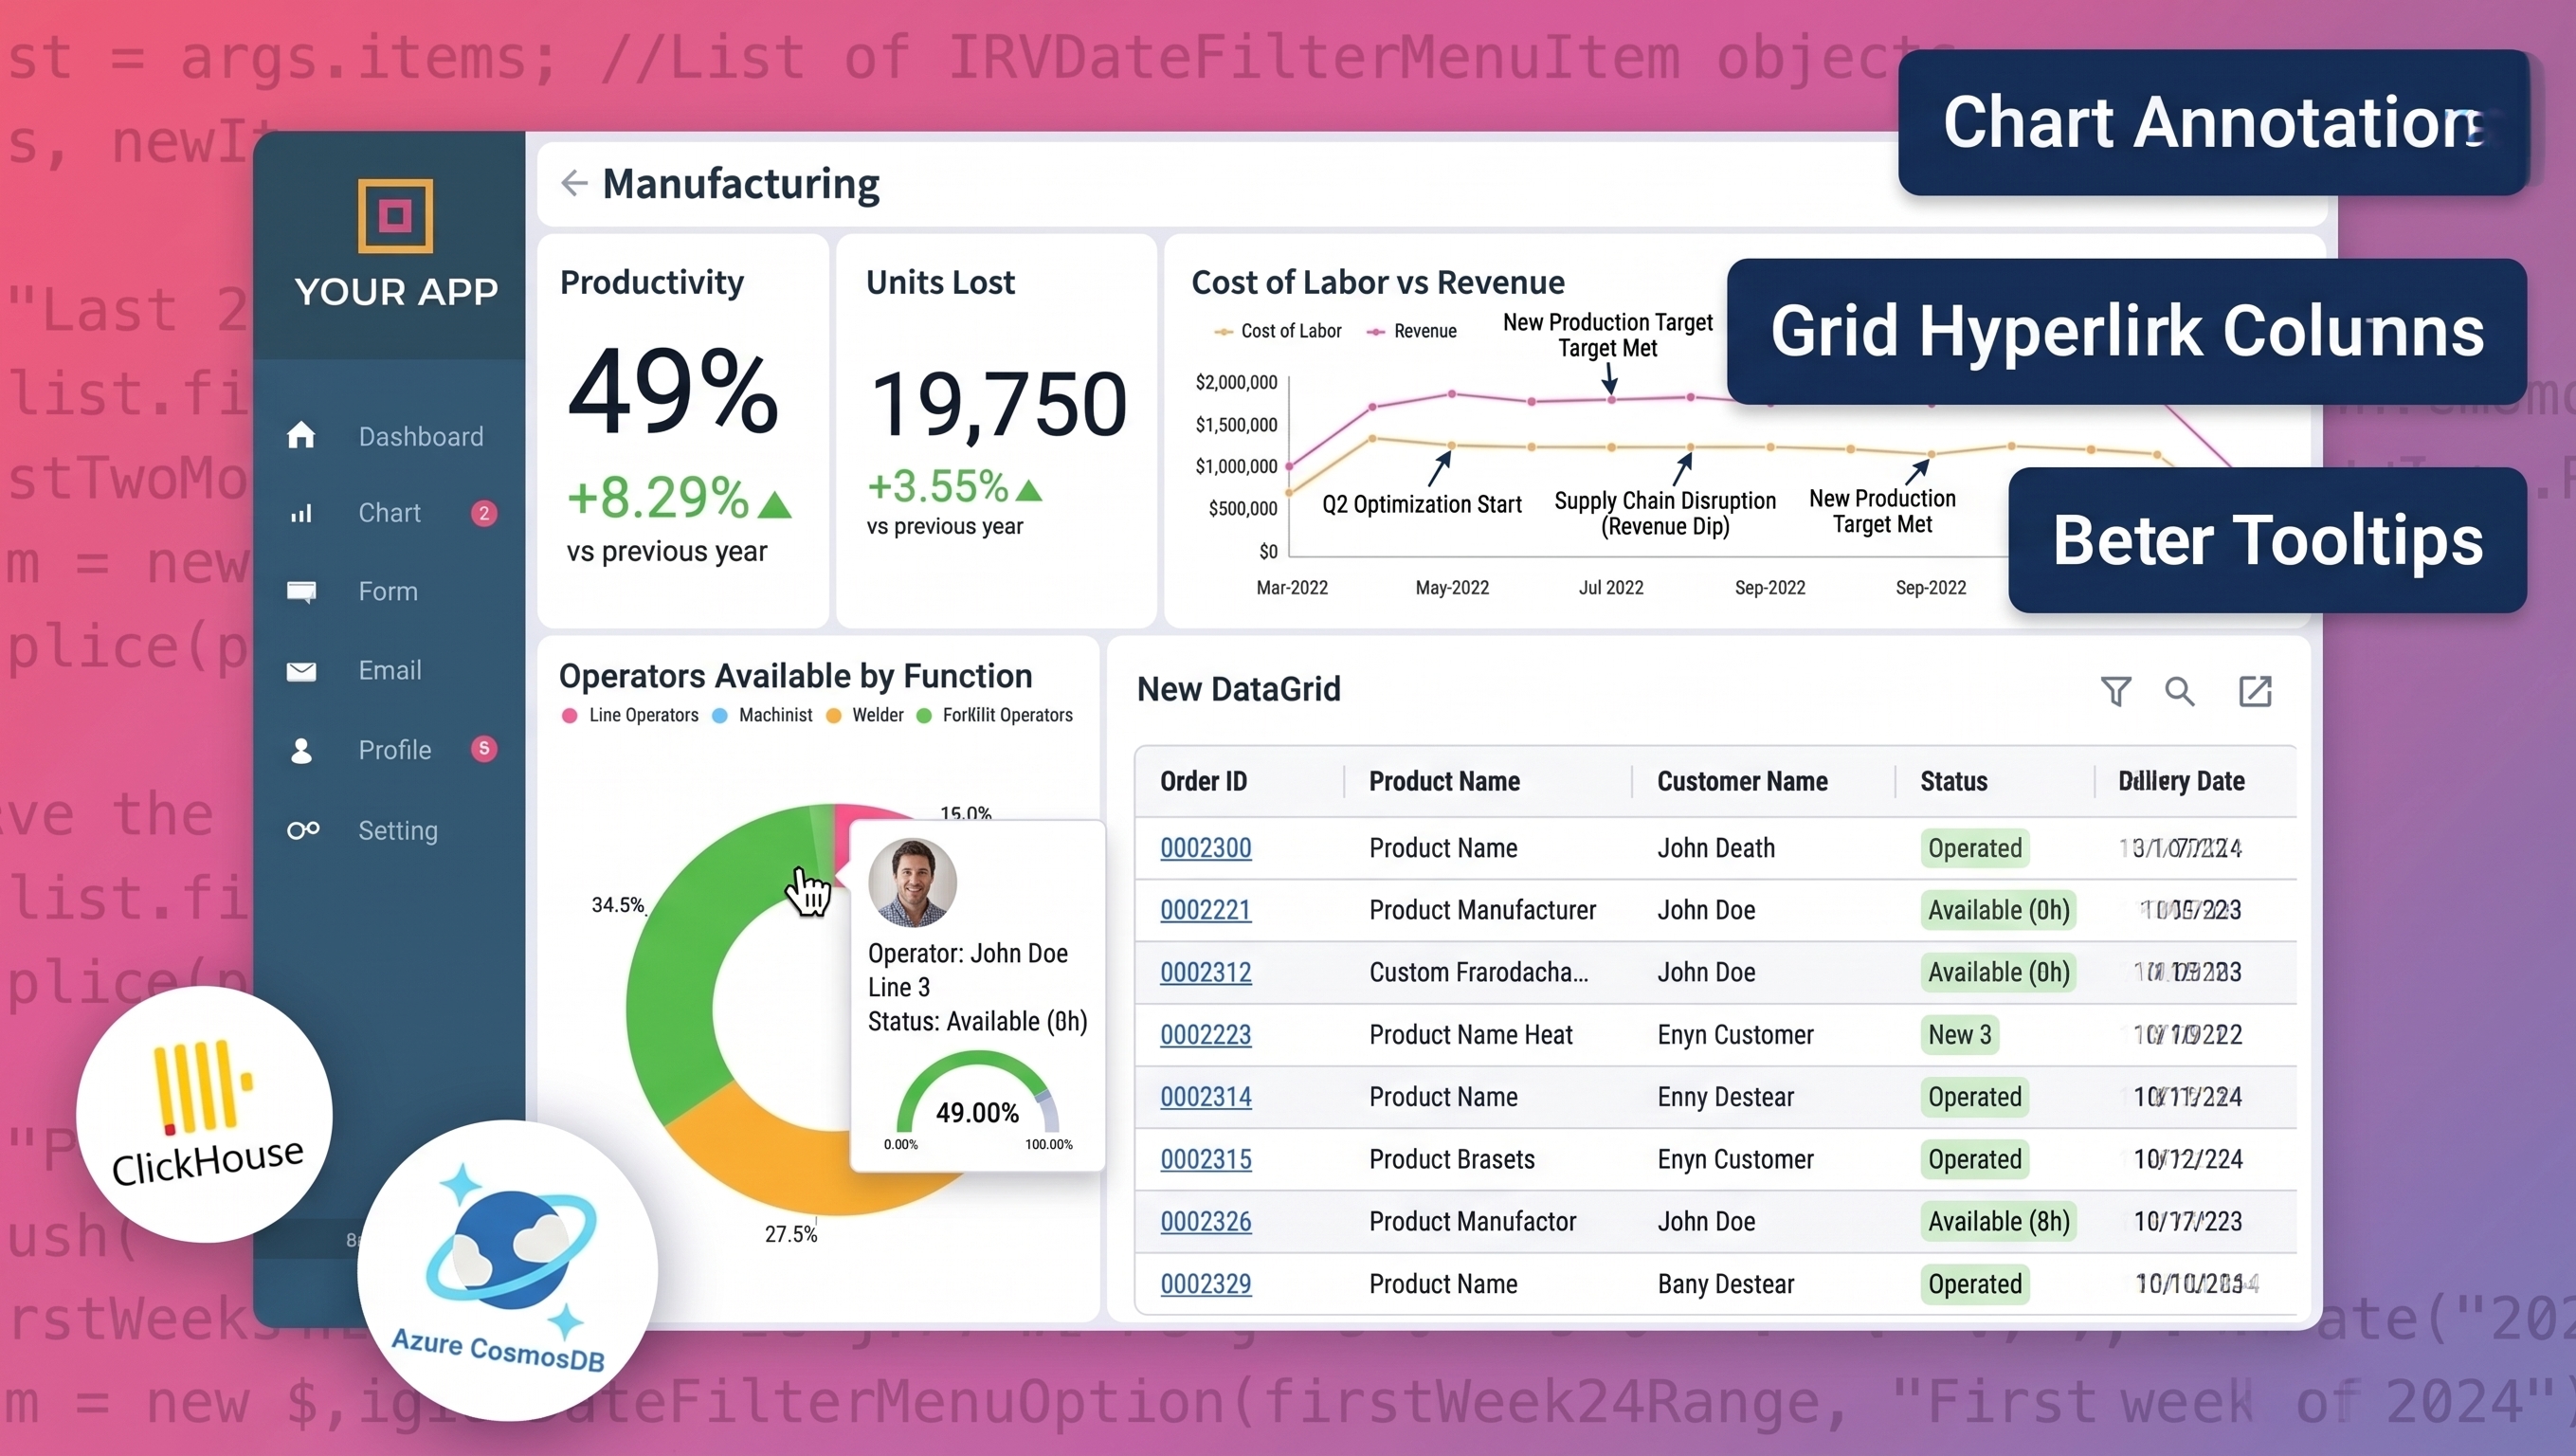
Scriptly Helps Pharmacies Identify Trends in Real Time with Reveal

Explore the complete guide to embedded analytics, including architecture, security, AI capabilities, implementation patterns, and evaluation criteria for modern applications.
Read Now
Fully branded white label dashboards offer custom personalization so that your customers can present a holistic service that is all branded to one company.
Read Now Learn which is the best white label analytics platform of 2025. See how the best 5 tools compare side-by-side on what matters most in our table
Key Takeaways:
Executive Summary:
We compared five white label analytics platforms across branding depth, integration architecture, multi-tenant performance, AI capabilities, and pricing transparency — the criteria that separate good demos from platforms that hold up in production.
Quick verdict by use case:
At some point in every SaaS product roadmap, analytics becomes the conversation nobody wants to have.
Your customers are asking for it. Your competitors are already shipping it. And somewhere in a planning meeting, someone suggests building it in-house — which sounds reasonable until an engineer explains what that actually involves: multi-tenancy, role-level data isolation, a visualization layer, UI consistency across every customer’s brand, real-time performance under load, and now AI on top of all of that. The estimate goes from six weeks to six months, and the sprint never starts.
So, you look at white label analytics platforms. And here’s where the second problem starts: most platforms are easy to demo and hard to ship. They look clean in a sandbox. Then you try to match your product’s design system and hit the ceiling. Or you embed via iFrame and your design team tells you it looks like a third-party tool bolted on. Or the pricing model made sense at 500 users and becomes a budget problem at 5,000.
We evaluated five platforms that SaaS companies and ISVs actually use, not on feature lists, but on the criteria that matter once you’re past the demo: how deep the branding control actually goes, whether the architecture survives multi-tenancy at scale, what AI looks like in practice, and what happens to your costs as your product grows.
Branding & UI control
Integration architecture (SDK vs iFrame)
Performance and scalability
Data connectivity
AI and advanced analytics capabilities
Pricing model and cost trajectory
White label analytics is embedded analytics that runs inside your product under your own brand, with no visible trace of a third-party tool. For SaaS teams and ISVs, this means delivering a fully branded data experience inside your product while keeping full control over the UX, the data access model, and how analytics scales as your customer base grows.
The distinction that matters most in 2026 is not whether a platform supports white labeling. Nearly all of them do in some form. It’s how deep that control goes, and whether the underlying architecture can support it at the scale your product requires.
Before comparing platforms, it helps to understand the three approaches — because the choice of approach determines what’s possible, not just what’s available.
| White Label Analytics | iFrame Embedded Analytics | Traditional BI | |
|---|---|---|---|
| Primary use case | Customer-facing analytics under your brand | Quick embedding of external dashboards | Internal reporting and data analysis |
| Branding & UI control | Full — every component, every interaction | Limited — surface CSS only, vendor UI visible | Fixed interface, minimal customization |
| Integration depth | SDK-native, inside your component tree | Isolated container, outside your application | External tool, loosely connected |
| User experience | Fully integrated into product workflows | Disconnected — separate interactions | Separate interface outside the product |
| Multi-tenant support | Built-in at the query layer | Requires workarounds, security risk | Not designed for SaaS multi-tenancy |
| Deployment | Cloud, hybrid, or on-premises | Typically cloud, tied to vendor | Standalone or cloud-based |
| AI capabilities | Embedded under your brand and governance | Limited or requires separate AI layer | Separate features, not workflow-integrated |
| Best for | SaaS products where analytics = product feature | Fast initial deployment, simple use cases | Internal data teams and analysts |
Most white label analytics platforms in 2026 use one of the first two approaches. The critical difference between them is the customization ceiling: iFrame-based platforms let you change what’s around the analytics interface. SDK-based platforms let you change the interface itself. That distinction shapes every evaluation question that follows.
| Branding & UI | Integration | Performance | Scalability | Data Sources | AI & Advanced | Pricing Model | |
|---|---|---|---|---|---|---|---|
| Reveal | Complete — full SDK control | SDK-first, cloud/on-prem/hybrid | Real-time, low latency | Multi-tenant at query level | SQL, NoSQL, 30+ cloud sources | AI, NLQ, conversational analytics | Fixed — no per-user fees |
| ThoughtSpot | Partial branding & theming | Visual Embed SDK, cloud only | Fast, search-driven | Enterprise scale | Broad cloud & DB support | AI-driven insights, NLQ | Usage-based — scales with volume |
| Luzmo | Partial — CSS theming | iFrame / web components | Fast, cached dashboards | Multi-tenant support | Good SQL/cloud coverage | Basic AI via Luzmo IQ | Usage-based — can escalate |
| Embeddable | Strong — headless React SDK | Headless SDK, cloud only | Sub-second via caching | Multi-tenant, semantic layer | Moderate — relies on APIs | Extensible charts & caching | Usage-based — scales with use |
| Sisense | Compose SDK | SDK + iFrame, cloud-first | High via Elasticsearch | High via ElastiCube engine | Broad — warehouses, SQL, live query | Sisense Intelligence, NLQ, AI insights | Quote-based — enterprise tier |
Reveal is an embedded analytics platform built specifically for SaaS products and ISVs, not adapted from an enterprise BI tool with an embed option added later. The architecture is SDK-first, which means analytics runs natively inside your application rather than loading inside an iFrame container that your customers can tell isn’t part of the product.

The distinction between SDK-based and iFrame-based embedding matters more than most teams realize until they’re mid-implementation. With iFrame embedding, you’re loading an external interface inside your product. You can style the container, but you can’t control what’s inside it. With Reveal’s SDK, analytics integrates directly into your application’s component tree, giving you complete control over the UI, the interaction model, and how data access maps to your existing permission system.
For ISVs and SaaS companies specifically, this translates to:
Complete white-label control: your colors, fonts, layouts, and component behavior, down to the button style. Customers never see Reveal branding unless you choose to include it.
Multi-tenancy enforced at the query level, not the UI. Each tenant’s data is isolated before any query returns, not filtered in the interface after the fact.
Deployment across cloud, on-premises, or hybrid. For regulated industries or data residency requirements, on-prem analytics isn’t a workaround. It’s a supported, first-class option.
AI analytics through the same SDK: users ask questions in natural language and get answers inside your product, scoped to their tenant and governed by your existing authentication model.
Fixed pricing regardless of user volume or query volume. As analytics adoption grows across your customer base, your costs don’t.
Initial SDK integration requires developer involvement. Teams accustomed to no-code or iFrame-based tools will need to invest engineering time upfront. This is a deliberate tradeoff. The depth of control Reveal provides isn’t possible without a proper integration. Most teams are in production within one to two weeks, but if you need something live in two days with no engineering resources, Reveal isn’t the right starting point.
Scriptly, a SaaS platform serving independent pharmacies, needed to give customers real-time visibility into prescription trends and inventory data, inside their product, under their brand. Their engineering team estimated months to build it themselves. With Reveal, they were in production in a week. Customers now interact with live data without leaving the Scriptly platform, and the feature became a measurable differentiator in sales conversations.
That scenario — analytics that looks and behaves like it was built by your own team, shipped in weeks rather than quarters — is what Reveal is designed to deliver.
ThoughtSpot is a cloud-based, search-driven analytics platform designed around natural language queries. Instead of building pre-defined dashboards, users type questions in plain language and get instant visualizations, reducing the analyst bottleneck for teams that need fast, ad-hoc data exploration.

Search-first interface: users get answers by asking questions, not navigating reports
SpotIQ AI surfaces trends and anomalies automatically, without manual analysis
Visual Embed SDK enables analytics embedded into applications
Strong cloud data source connectivity
Branding flexibility is limited compared to a fully customizable white label platform — theming options exist, but deep UI control is constrained. Deployment is cloud-only, which limits options for regulated industries. Pricing is usage-based, which creates cost unpredictability as you scale analytics across a large customer base. Some teams report a learning curve before the search-driven experience feels natural for non-technical users.
ThoughtSpot excels at unstructured, ad-hoc data exploration for users who know what questions they want to ask. It reduces dependence on pre-built dashboards and analyst resources. If your customers are data-sophisticated and value self-directed exploration over a polished guided experience, ThoughtSpot delivers.
Luzmo is a lightweight white label analytics platform designed for fast dashboard deployment. Its drag-and-drop editor and simple embedding process make it accessible for non-technical teams who need dashboards live quickly without deep developer involvement.

Fast embedding via iFrame or web components
Drag-and-drop editor for non-technical dashboard creation
CSS-level theming for colors, fonts, and basic visual customization
Good SQL and cloud data source coverage
AI insights via Luzmo IQ
Branding control is constrained by the iFrame embedding model. You can style the container, but deep UI integration with your product’s design system hits a ceiling quickly. Deployment is cloud-only. Usage-based pricing becomes expensive as you scale across multiple tenants. AI capabilities are still early-stage compared to SDK-first platforms.
Luzmo’s strength is simplicity and speed. For teams that need good-looking dashboards live quickly and can accept the limitations of iFrame embedding, it removes friction from the initial deployment. The tradeoff is architectural flexibility which tends to become a constraint as the product scales.
Embeddable is a developer-focused platform that takes a headless approach to analytics, giving front-end teams complete control over how analytics renders inside their product. If your goal is pixel-perfect UI integration and your team has the engineering capacity to own it, Embeddable is worth a serious look.

Headless React/JS SDK gives developers complete UI control
Sub-second load times through caching and semantic layer
Multi-tenant support with row-level security
Extensible charting library for custom visualization needs
Native integration with Cube Cloud for semantic layer management
Cloud-only deployment limits options for regulated industries. Native data connector coverage is narrower than SDK-first platforms like Reveal or Qrvey. Integration often relies on APIs or Cube Cloud, adding a dependency. Developer involvement is required for setup and ongoing customization, which is by design but can be a constraint for teams without dedicated front-end resources.
The headless architecture is genuinely differentiated. For a product team that wants analytics to feel completely native, indistinguishable from the rest of the product, and has the engineering capacity to build it that way, Embeddable removes the visual constraints that iFrame-based platforms impose.
Sisense is an enterprise-grade embedded analytics platform built around its Fusion architecture and the Compose SDK, which lets development teams embed analytics components directly into their applications. It’s most often chosen by SaaS providers with large data volumes, complex modeling requirements, or enterprise customers who expect analytics to perform at scale.
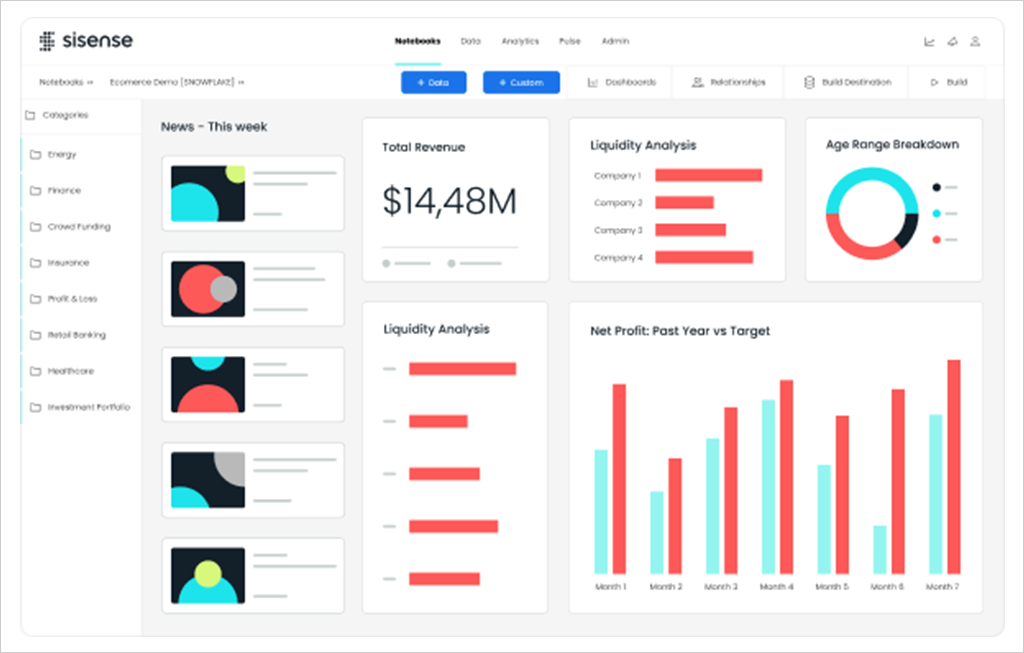
Compose SDK for React, Angular, and Vue, with component-level embedding
ElastiCube engine designed for high-volume, high-concurrency workloads
Strong AI capabilities through Sisense Intelligence, including natural language query and automated insights
Broad data connectivity across cloud warehouses, SQL, and live query sources
Mature multi-tenancy with row-level security and tenant isolation
The depth of the platform comes with implementation overhead — Sisense is a substantial engineering commitment, and teams without dedicated data and front-end resources will feel that quickly. Pricing is quote-based and tends to land in the enterprise range, which can be a barrier for earlier-stage SaaS products. Deployment is primarily cloud, with limited options for teams that need on-prem or hybrid architectures.
Sisense is built for scale in a way most embedded analytics platforms aren’t. If your product serves enterprise customers with millions of rows of data, high concurrent usage, and complex data models that need to perform under load, Sisense’s analytics engine holds up where lighter-weight platforms start to strain. The tradeoff is the investment — both in implementation and in cost — required to get there.
The comparison above reflects the features that matter most in production, not in demos. When you’re evaluating platforms for your product, these are the criteria that separate a good experience from a liability at scale.
Dashboards should be indistinguishable from the rest of your product. Look for platforms that give you control over colors, fonts, layouts, component behavior, and domain, not just a logo swap. The test: if your customers can tell the analytics section looks different from everything else in your product, the white labeling isn’t deep enough.
An SDK-first approach integrates analytics into your application’s component tree. iFrame embedding loads an external interface inside a container. You control the frame, not what’s inside it. The difference matters when you need to customize interactions, match your design system precisely, or integrate with your existing authentication and permission model. Look for SDK support across the frameworks your team already uses: React, Angular, .NET, Blazor.
Multi-tenancy that’s enforced in the UI, filtering what users see after data is returned, is a security risk. True multi-tenancy isolates each tenant’s data before any query is executed. This is the architectural difference that determines whether your platform can safely serve hundreds of customers from a single deployment.
Adoption drops when dashboards lag. Evaluate how platforms handle concurrent users, complex queries, and large datasets. Ask specifically about performance at the scale you expect in 12 months, not your current scale — the answer is often different.
Usage-based pricing can look reasonable early and become a significant cost center as analytics adoption grows. Model out what your costs look like at 3x your current user count before committing. Fixed pricing tied to application deployment, not user volume, is significantly easier to budget and doesn’t create a disincentive to drive analytics adoption inside your product.
AI capabilities in 2026 range from marketing copy to genuine product functionality. What to look for: natural language query (users ask questions, get answers), automated insight surfacing, and AI that’s governed by your existing data access model rather than operating as a separate layer. If the AI feature requires a different authentication flow or can’t respect tenant-level data isolation, it’s not ready for production.
The right choice depends on what you’re optimizing for, and what you’re willing to trade.
If you need dashboards live quickly and your customers won’t look closely at whether the analytics UI matches your product exactly, Luzmo removes friction from the initial deployment. Just model out what usage-based pricing looks like at scale before you commit.
If your users are data-sophisticated and value driving their own exploration over guided dashboards, ThoughtSpot’s search-first model is genuinely differentiated. Be clear-eyed about the cost trajectory as you scale.
If your team has strong front-end capacity and wants analytics to feel completely native, with the engineering investment that requires, Embeddable’s headless approach gives you that control.
If you’re serving enterprise customers with large data volumes and complex modeling requirements, and your team has the engineering capacity to invest in a deep implementation, Sisense holds up at scale where lighter platforms strain.
And if analytics is a core part of your product, something that appears in your sales conversations, something your customers depend on daily, something that needs to evolve as your product evolves, then the tradeoffs that feel acceptable at the demo stage tend to show up later. The iFrame ceiling when your design team asks why analytics looks different from everything else. The pricing conversation as adoption grows. The multi-tenancy concern when you’re onboarding a customer who needs strict data isolation.
Reveal is built for teams that have already had that conversation or want to avoid having it. Full SDK control, white-labeled by default, multi-tenant at the query level, AI embedded in the same layer, and pricing that doesn’t change because your product succeeded.
A white label analytics platform lets you embed dashboards, reports, and data experiences inside your product under your own brand — with no visible trace of a third-party tool. The depth of white labeling varies: some platforms offer logo swaps and color theming; others give you full control over every UI component, interaction, and behavior.
iFrame embedding loads an external analytics interface inside a container in your product. You control the container’s size and position, but not the UI inside it. SDK-based embedding integrates analytics directly into your application’s component architecture, giving you control over the interface, interactions, and data access. The practical difference: SDK-based embedding has no ceiling on customization. iFrame embedding does.
Critical if you serve multiple customers from a single platform. Multi-tenancy enforced at the data layer means each tenant’s data is isolated before any query executes, not filtered in the UI afterward. UI-level filtering is a security risk: it can be bypassed, and it doesn’t provide genuine data isolation. Ask any vendor you’re evaluating specifically whether tenant isolation is enforced at the query level or the application level.
Look for AI that operates within your existing governance model, not as a separate layer that requires its own authentication or data access configuration. The questions to ask: Can users query data in natural language within your product interface? Is the AI’s data access scoped to the user’s tenant and role? Are token costs predictable and controlled? If the answer to any of these is unclear, the AI feature isn’t production-ready.
Don’t evaluate pricing at your current user count. Model it at 3x and 10x. Usage-based pricing (per query, per user, per data volume) that looks affordable early becomes a significant cost center as analytics adoption grows. Fixed pricing tied to application deployment, not usage, is significantly easier to budget and removes the perverse incentive to limit analytics adoption to control costs.


 Return to Blog

 ChatGPT
 Perplexity