
Scriptly Helps Pharmacies Identify Trends in Real Time with Reveal
Explore the complete guide to embedded analytics, including architecture, security, AI capabilities, implementation patterns, and evaluation criteria for modern applications.
Read NowFully branded white label dashboards offer custom personalization so that your customers can present a holistic service that is all branded to one company.
Read NowEmbedded analytics insights, how-tos and product news from Casey Ciniello.

Reveal AI now supports OpenAI, Google, and Anthropic out of the box, plus your own model, at full feature parity across .NET, Node, and Java. Smarter dashboard generation, per-tenant AI refresh, and support for longer-running reasoning models.
Continue reading...
Reveal 2.0 is a full modernization of the Reveal Web SDK: no jQuery dependency, TypeScript-first, ESM and IIFE builds, npm or CDN install, new CosmosDB and ClickHouse connectors, stronger accessibility, and Node/Java SDK parity in Preview.
Continue reading...
Learn what an analytics SDK is and how to choose the right one for your SaaS product. See what to look for to scale without constraints.
Continue reading...
Struggling with dashboard adoption? Learn why users ignore dashboards and how embedded analytics drives real usage and better decisions.
Continue reading...
AI token cost is now a line item in the CIO’s budget, especially for SaaS teams shipping AI-powered embedded analytics. Every natural language query, generated dashboard, and automated insight inside your embedded analytics layer burns tokens from large language models. Across a multi-tenant SaaS platform with thousands of users, that adds up fast. Controlling AI token consumption requires real governance: guardrails, model flexibility, and usage monitoring. Reveal built these controls into its AI-powered embedded analytics from day one, so your team can scale AI analytics without watching costs spiral.
Continue reading...
Meet Reveal AI, the AI-native embedded analytics layer for SaaS and enterprise apps. Add conversational analytics and governance into your app
Continue reading...
Slow BI quietly reduces adoption, retention, and revenue in SaaS products. Learn how performance impacts growth and how to fix it.
Continue reading...
Learn how analytics adoption grows, why non-tech users struggle, and how leaders prompt new users to their product's analytics layer.
Continue reading...
How AI-powered analytics accelerates data insights and why Reveal offers secure, customer-controlled embedded AI analytics for modern apps.
Continue reading...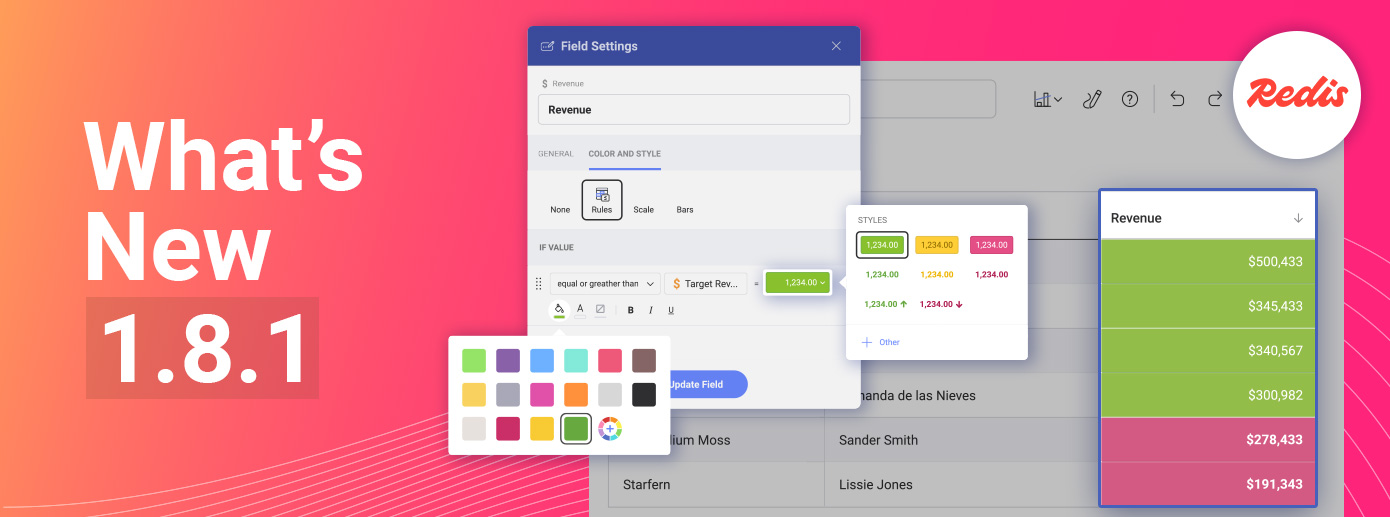
Reveal 1.8.1 introduces two major upgrades: Conditional Formatting and the Redis Cache Provider. These updates make embedded analytics faster, clearer, and easier to scale. Conditional Formatting lets users apply rule-based color logic directly to charts, turning data into instant visual insight. The Redis Cache Provider delivers enterprise-level performance with distributed in-memory caching for real-time workloads. Together, these enhancements help developers and SaaS leaders build smarter, high-performing dashboards while keeping Reveal the standard for customizable and scalable embedded BI that delivers insight without complexity.
Continue reading...
Data integration challenges raise costs and slow SaaS growth. Discover how embedded analytics delivers faster, simpler scaling.
Continue reading...
Learn how to transform your product analytics into a powerful source of fresh revenue. Discover how Embedded Analytics will scale your profits
Continue reading...
How fast will your product get on the oversaturated SaaS product market will determine its success. Reduce time to market with embedded analytics
Continue reading...
Learn Looker Embedded's benefits and downsides. Understand why so many users are looking for Looker alternatives, despite its reputation
Continue reading...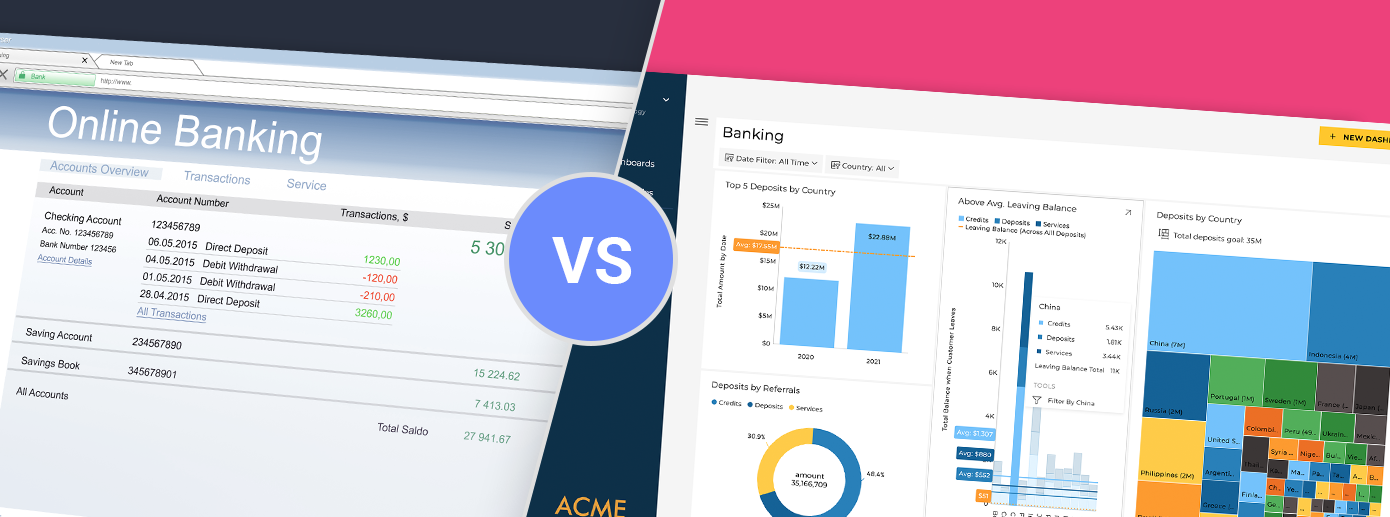
Find out what a modern embedded analytics solution is and how it can replace your legacy analytics while lowering costs and boosting adoption
Continue reading...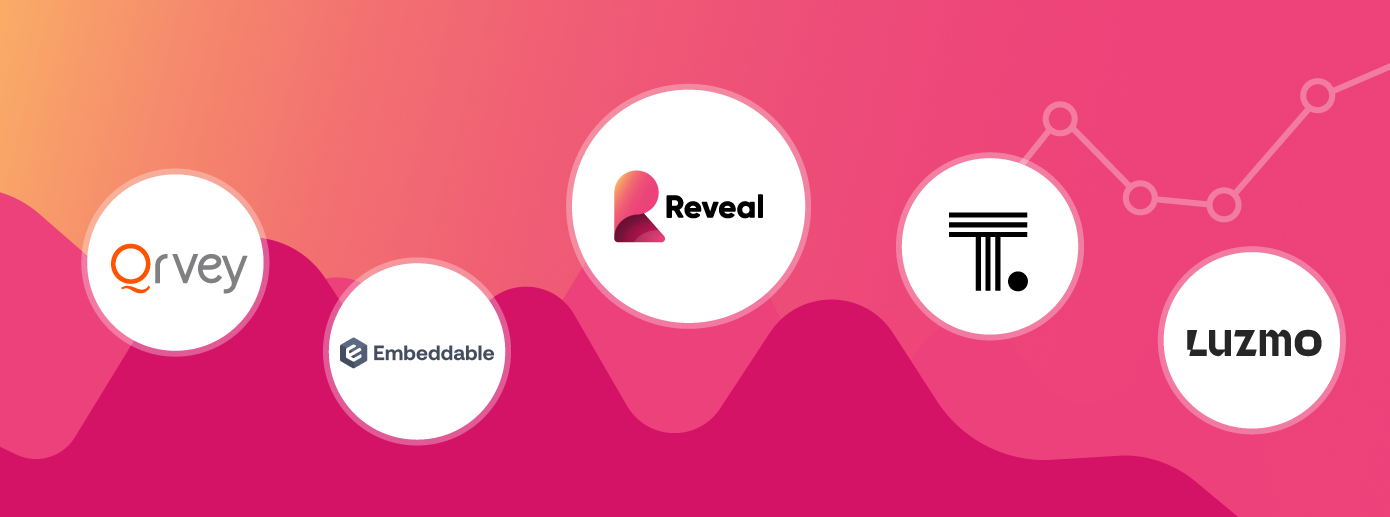
Learn which is the best white label analytics platform of 2025. See how the best 5 tools compare side-by-side on what matters most in our table
Continue reading...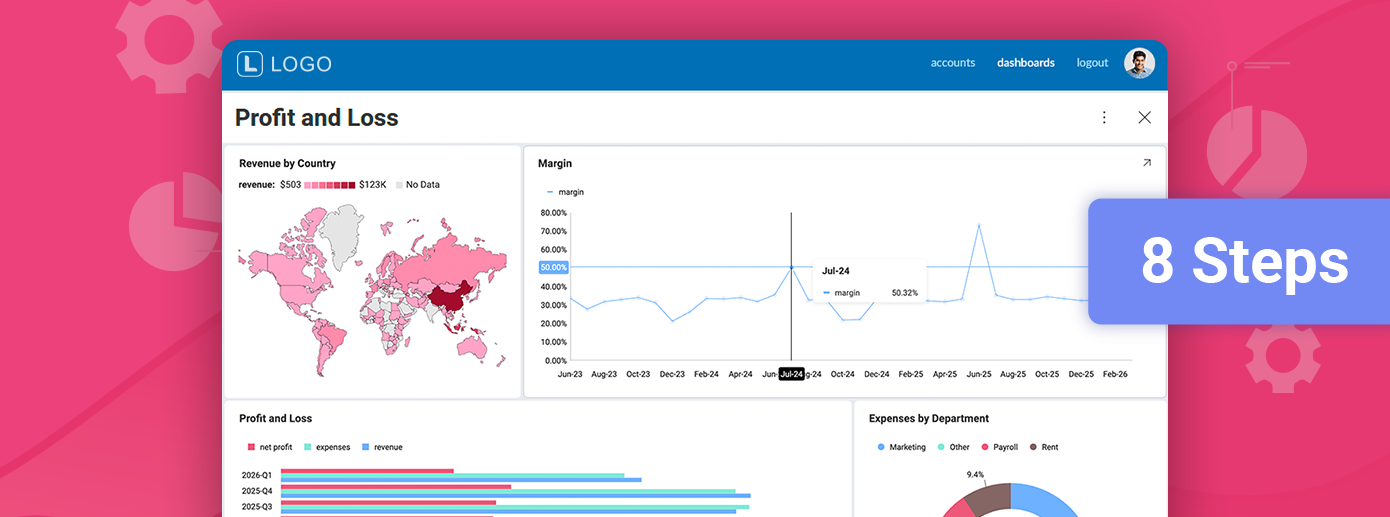
Customers expect insights inside the product, not in external BI portals. Learn the 8 steps of how to integrate embedded analytics in FinTech
Continue reading...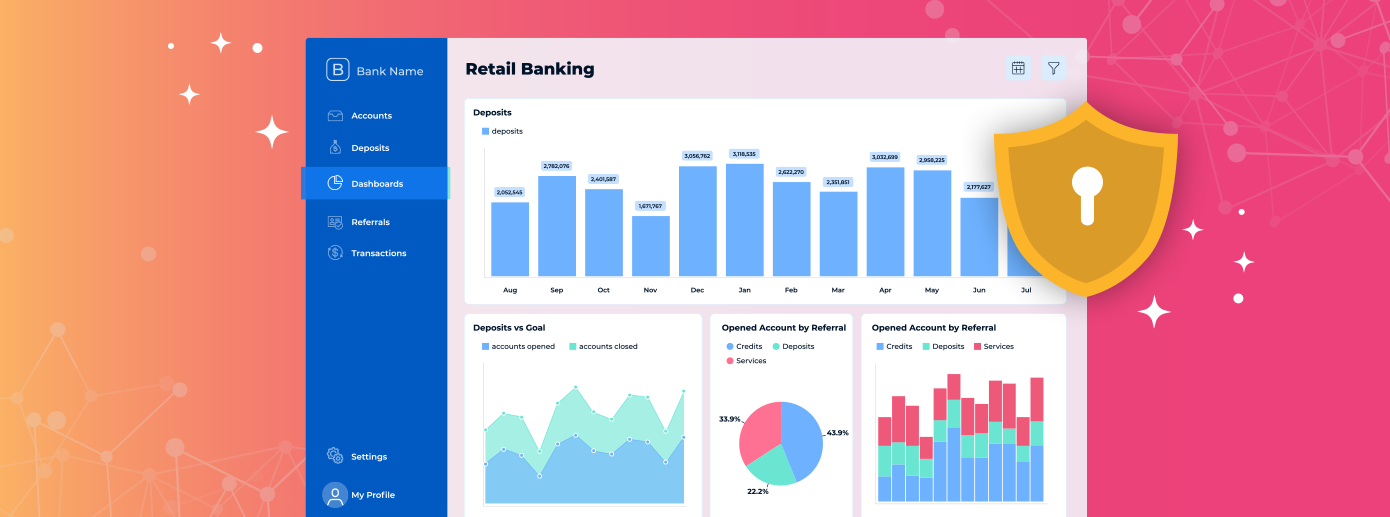
Learn how to ensure security with embedded analytics before implementing AI-powered analytics from a third-party provider.
Continue reading...
Scalable analytics helps SaaS teams keep insights fast, flexible and user-friendly as products grow. Learn how to build for growth and enhance your BI
Continue reading...
Most enterprise BI platforms were built for internal reporting, not for modern SaaS products utilizing customer-facing analytics. They sit outside your application, fragment your UX, and delay decision-making. Modern enterprise software requires analytics that are intuitive, embedded, and self-service by design. Reveal was built to deliver exactly that—with no iFrames, no handoffs, and no compromises.
Continue reading...
Learn what is self-service BI and how it can help you improve your SaaS or ISV product. Know what are the benefits, what problems you may face.
Continue reading...
Starting today, Reveal users can connect directly to their Databricks environment and build real-time dashboards using our fully embedded analytics experience.
Continue reading...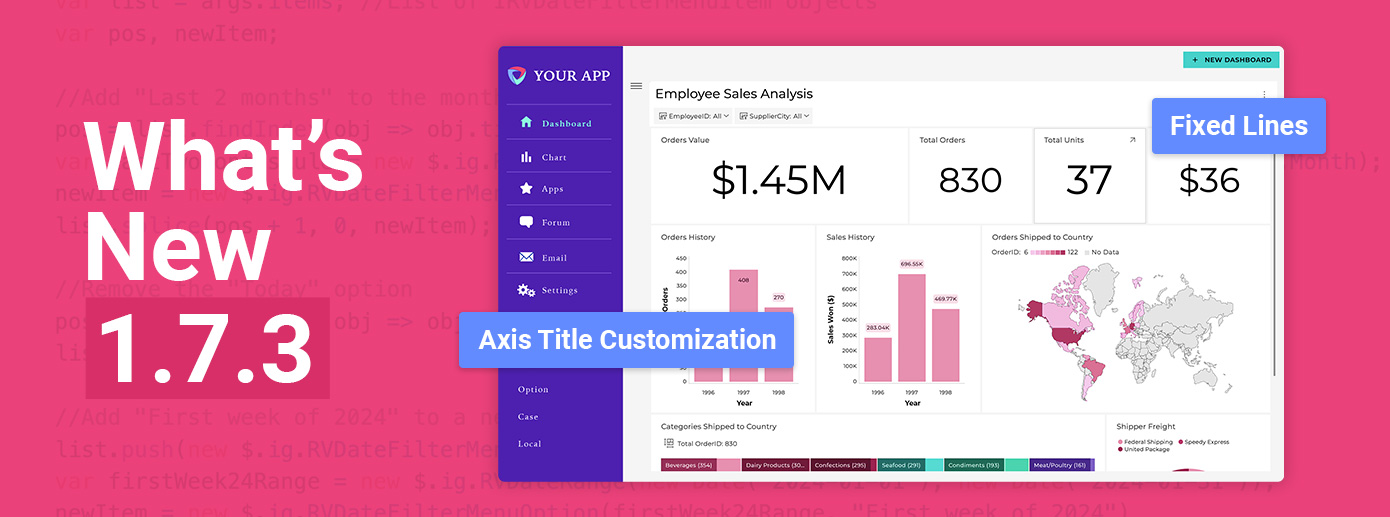
Reveal Version 1.7.3 is live, bringing powerful new enhancements that put more control in the hands of developers and product teams. Find out more!
Continue reading...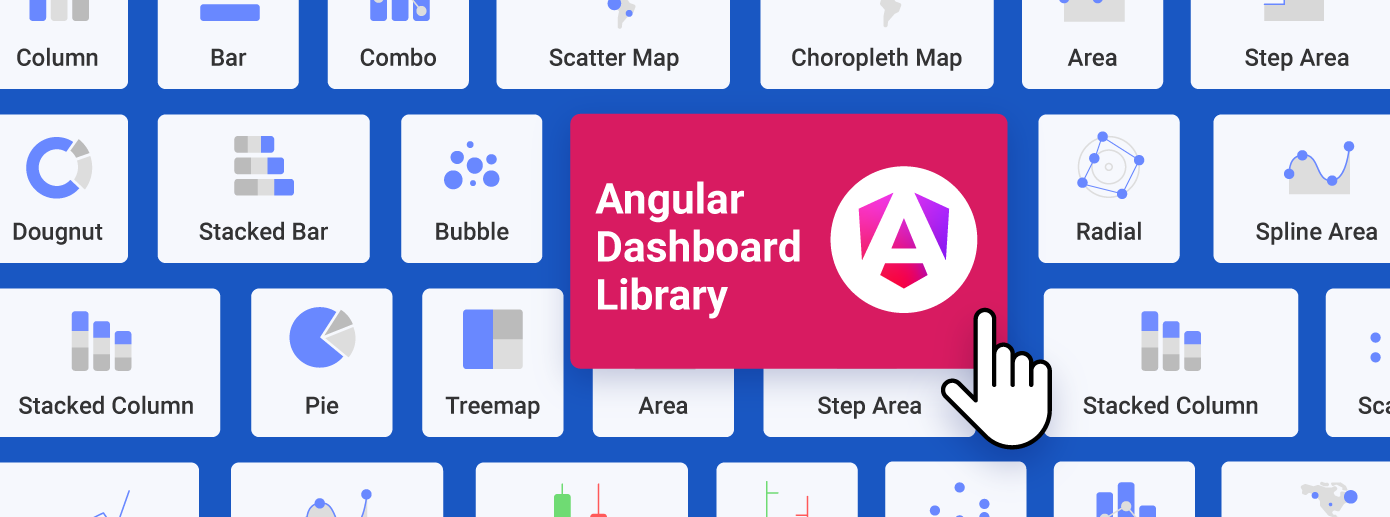
Choosing the best angular dashboard library is hard. So, we created the ultimate guide in finding the perfect Angular dashboard library.
Continue reading...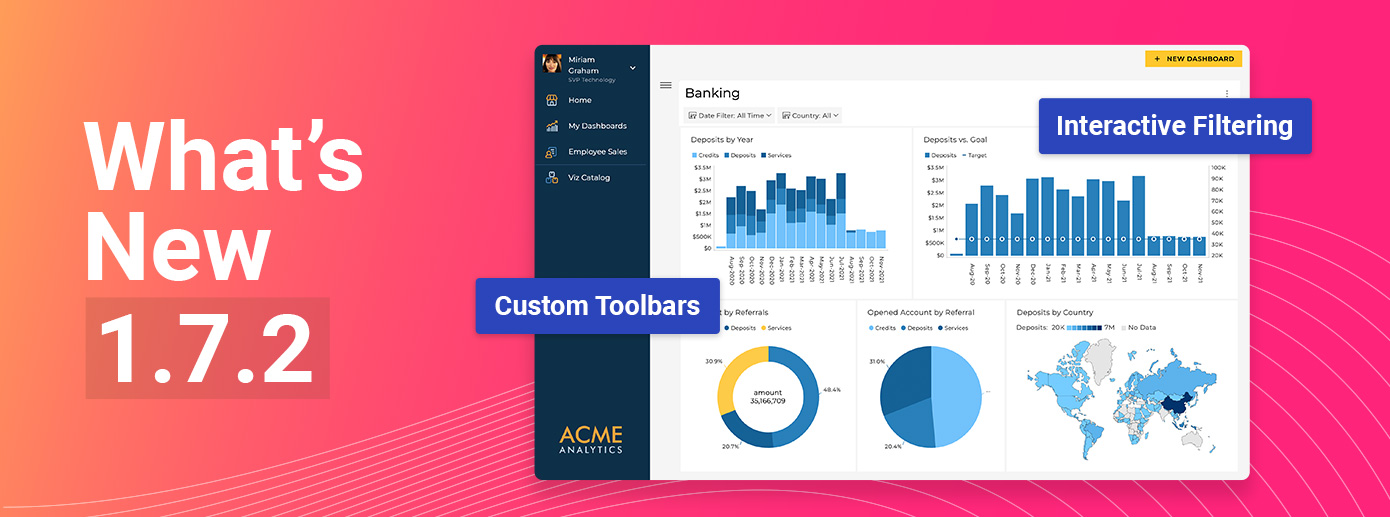
Reveal Version 1.7.2 is Live! Gain full control with powerful customization tools and seamless data interaction to build tailored, intuitive analytics experiences.
Continue reading...
Find out how to integrate embedded analytics into Angular applications with a .NET Core backend, for better decision-making capabilities that drive engagement and ROI.
Continue reading...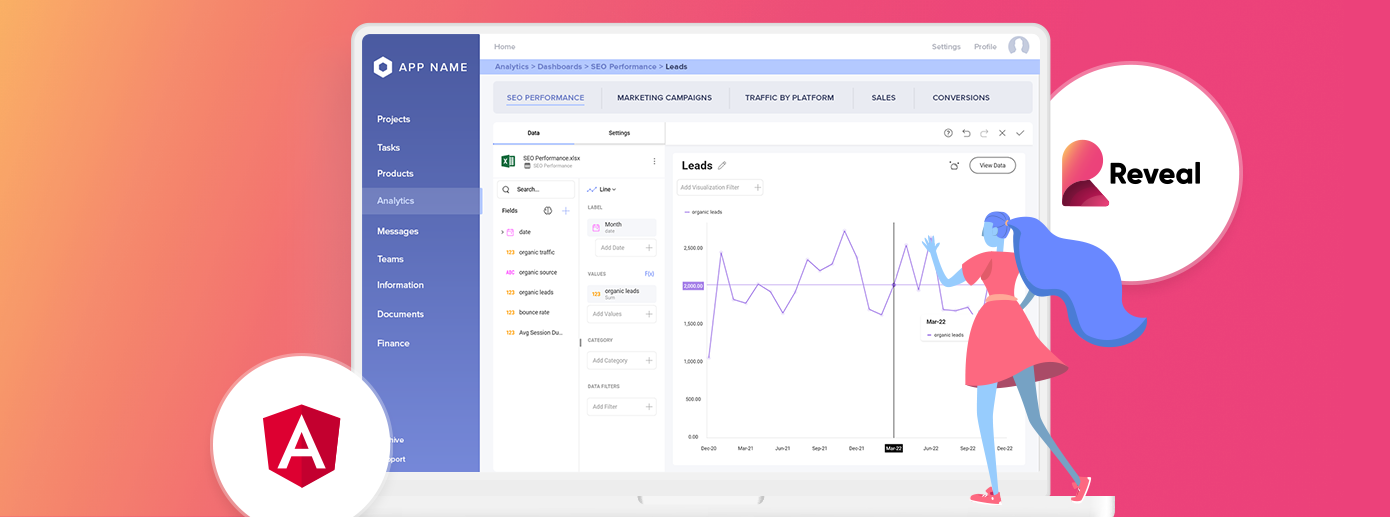
Learn how using incorporating angular BI, can help you streamline workflows, manage resources and optimize performance for your apps.
Continue reading...
In this guide, we’ll cover the key 2025 requirements for selecting an embedded analytics platform, how it benefits product analytics, and the current available implementation methods.
Continue reading...
Learn how to harness data-driven insights to enhance user engagement, all while exploring the synergy between product analytics and embedded analytics for 2025.
Continue reading...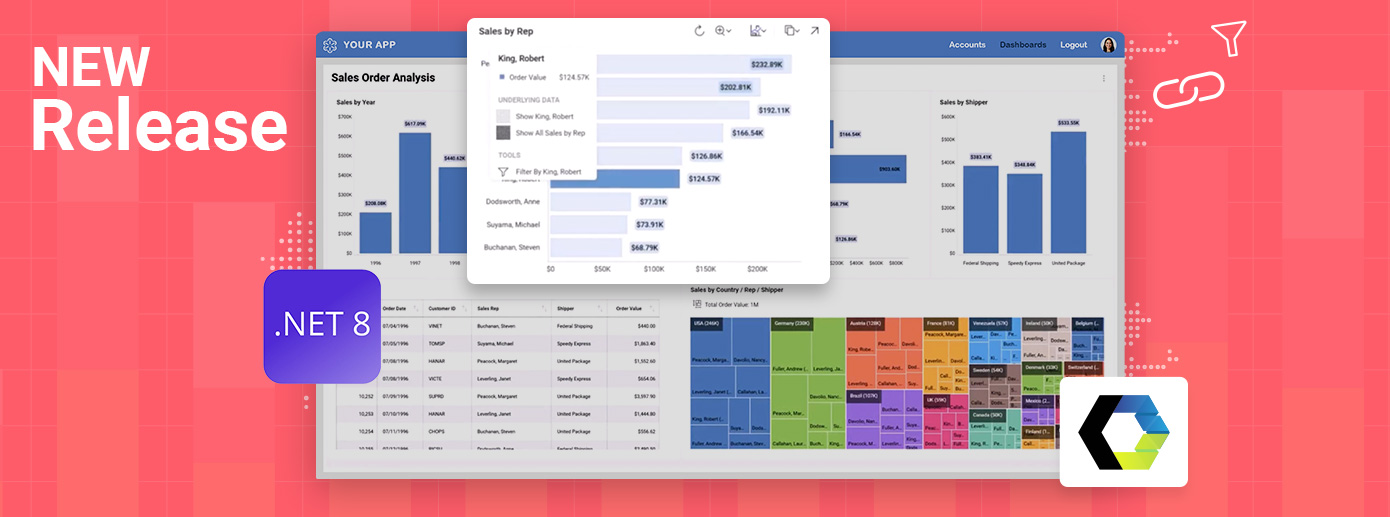
Reveal is excited to launch new features and updates designed to enhance your development experience and deliver more flexibility and control for embedding analytics.
Continue reading...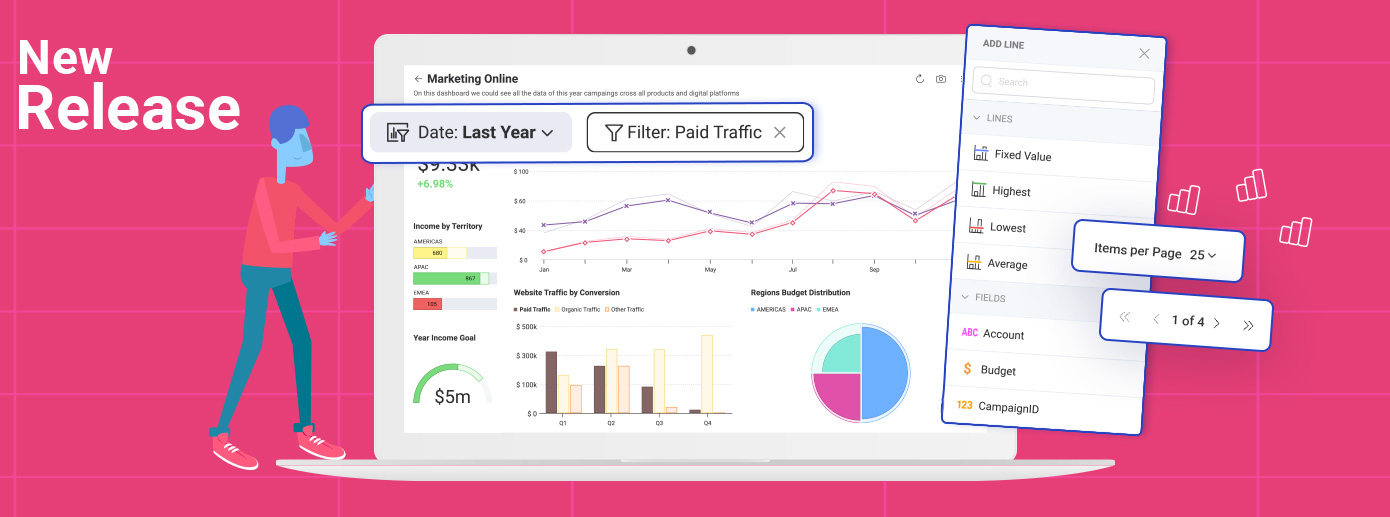
We’re excited to announce the latest Reveal release, packed with powerful new features designed to enhance your analytics capabilities while keeping you informed of critical breaking changes that may impact your applications.
Continue reading...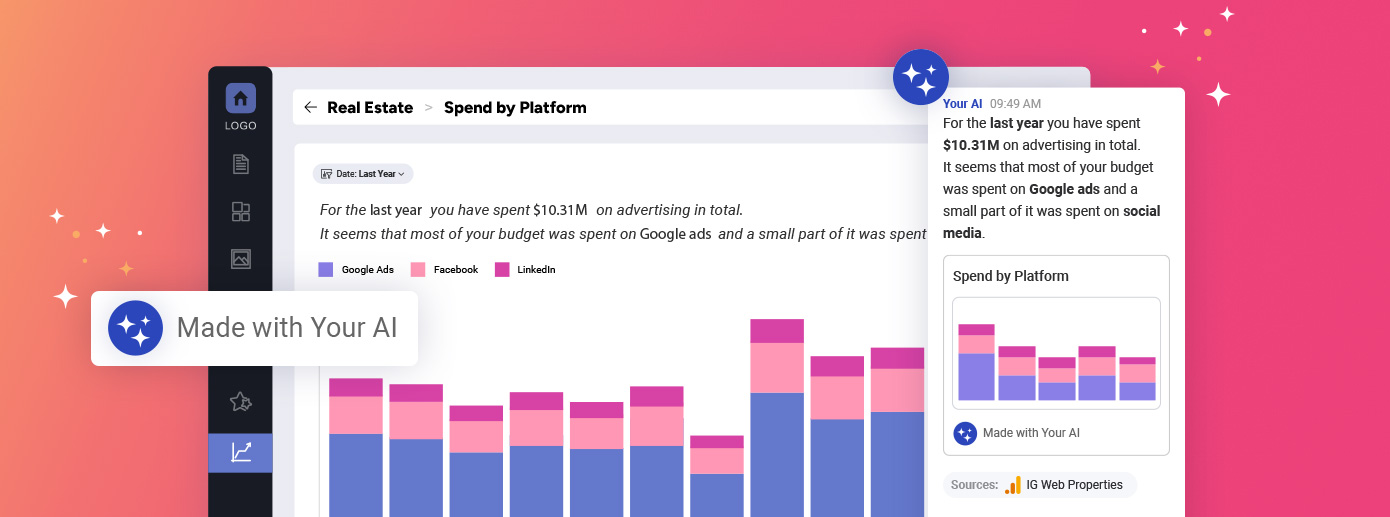
Learn how AI turns natural language into insights and how conversational analytics boost Saas and ISV products adoption and monetization
Continue reading...
Discover 5 effective strategies to overcome integration challenges in embedded analytics and enhance your analytics integration for seamless performance. Find out more.
Continue reading...
Explore the implications of limited customization in embedded analytics and why it’s a critical issue for CTOs, product managers, and development teams. Read more!
Continue reading...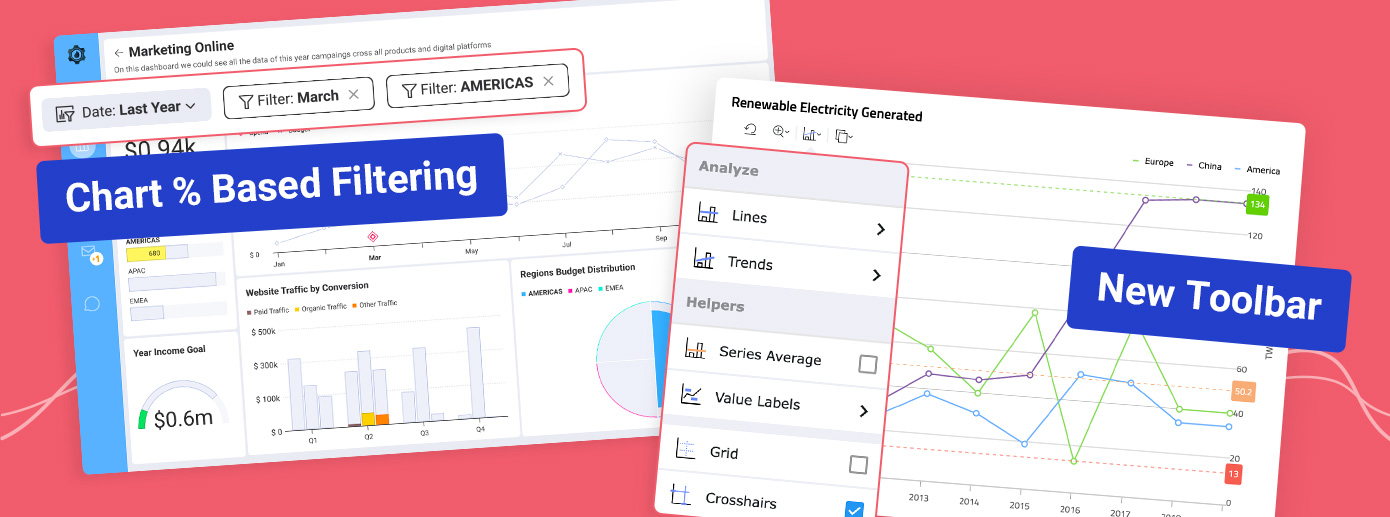
This release introduces a series of new powerful analytics features designed to offer superior customization, deeper integration, and more robust analytics capabilities.
Continue reading...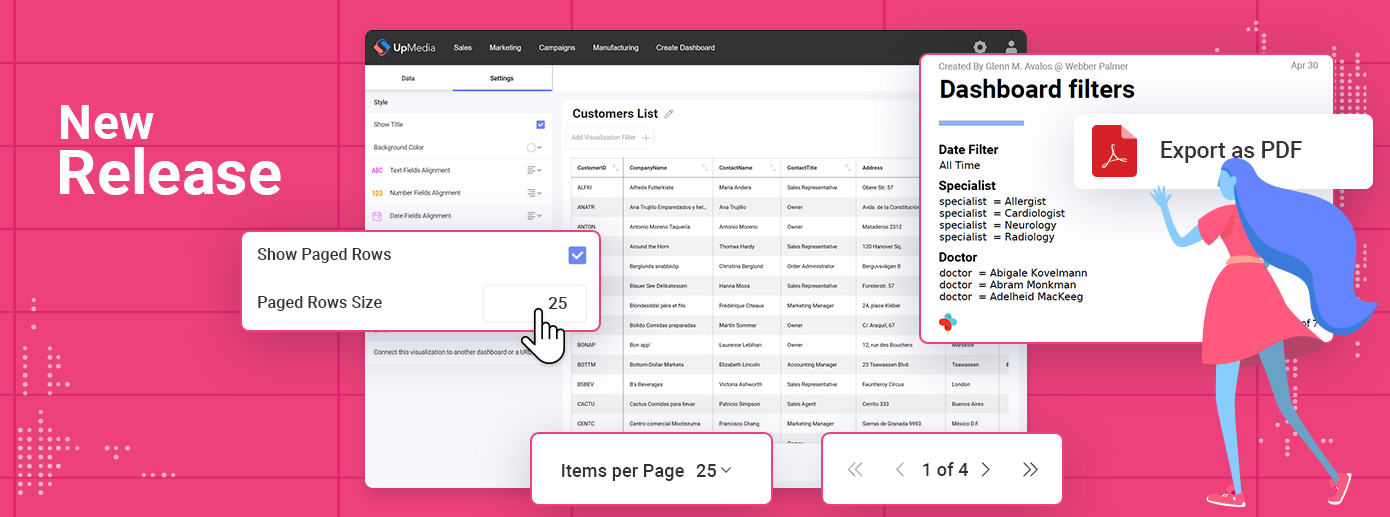
We are excited to announce the release of Reveal 1.6.6 which brings several new features and improvements that will enhance your embedded analytics experience. Find out more!
Continue reading...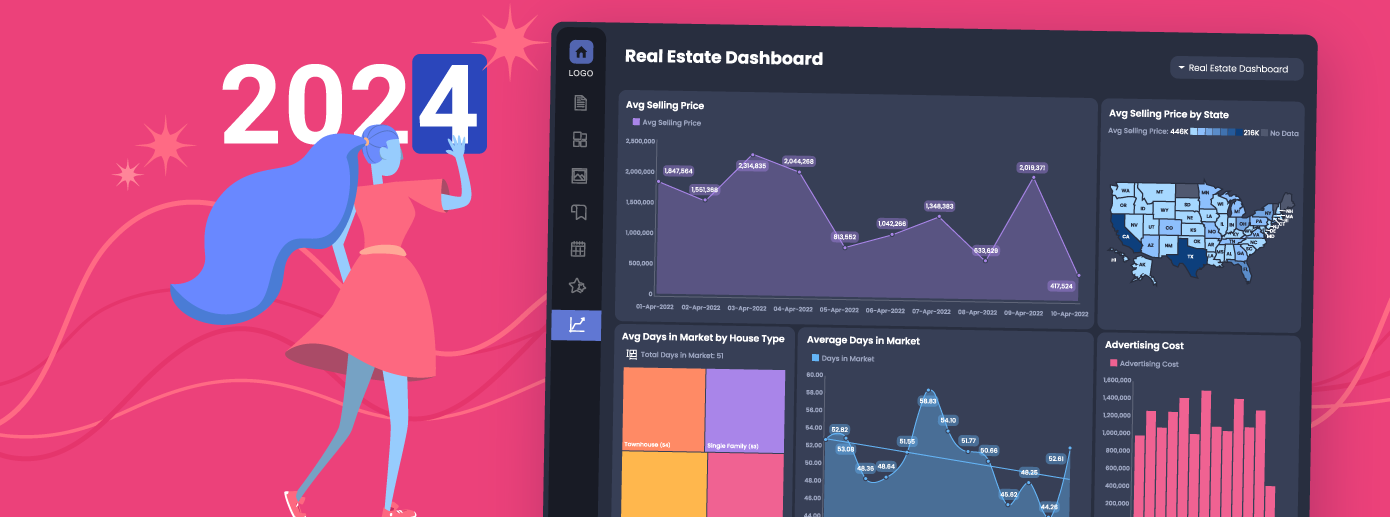
Reveal roadmap for 2024 introduces many new features that will take your analytics game to the next level next year. Get ready to be excited!
Continue reading...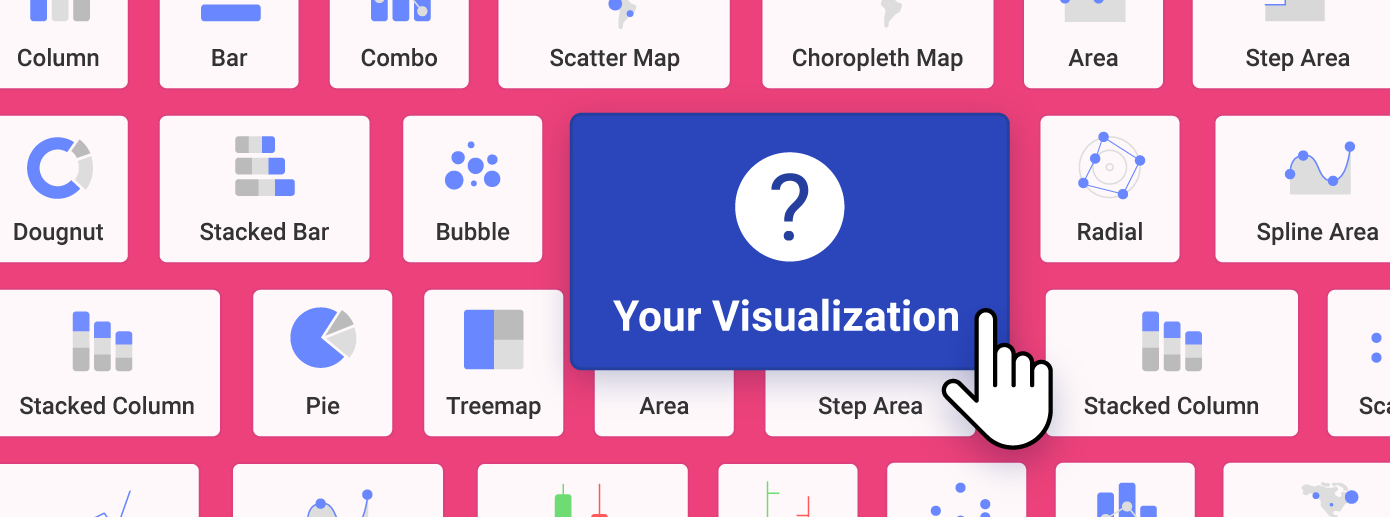
Learn why DIY data visualizations are becoming the norm in SaaS and ISV products. Understand the benefits and how to get them for your product.
Continue reading...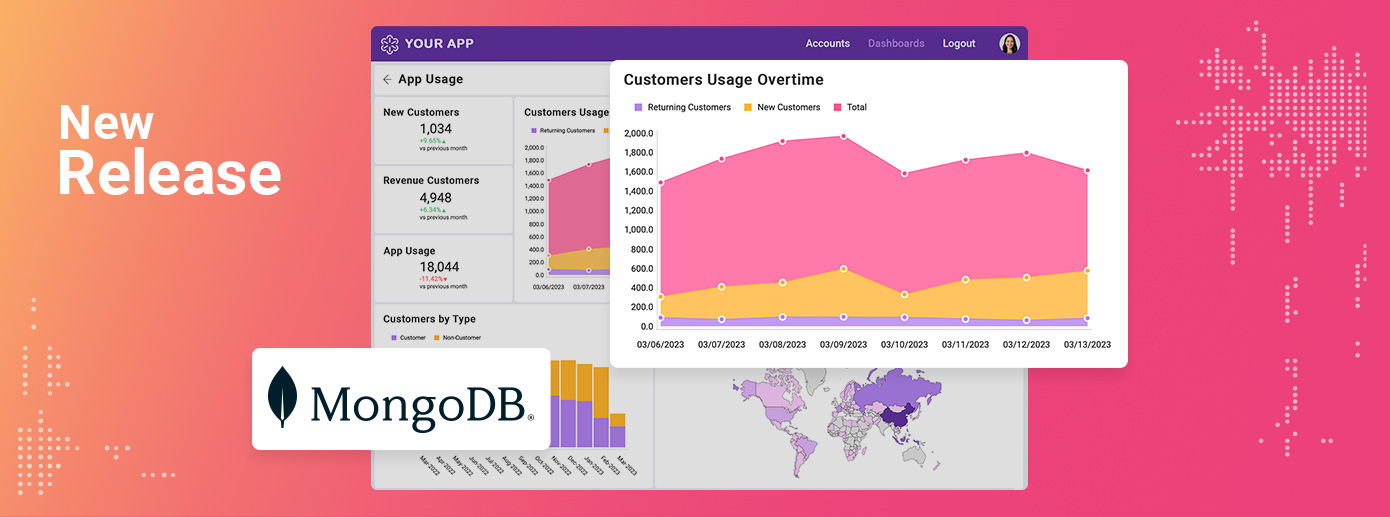
Reveal 1.6.1 is here, and it's all about you! Discover enhanced user experience, smoother exports, and more in our latest release.
Continue reading...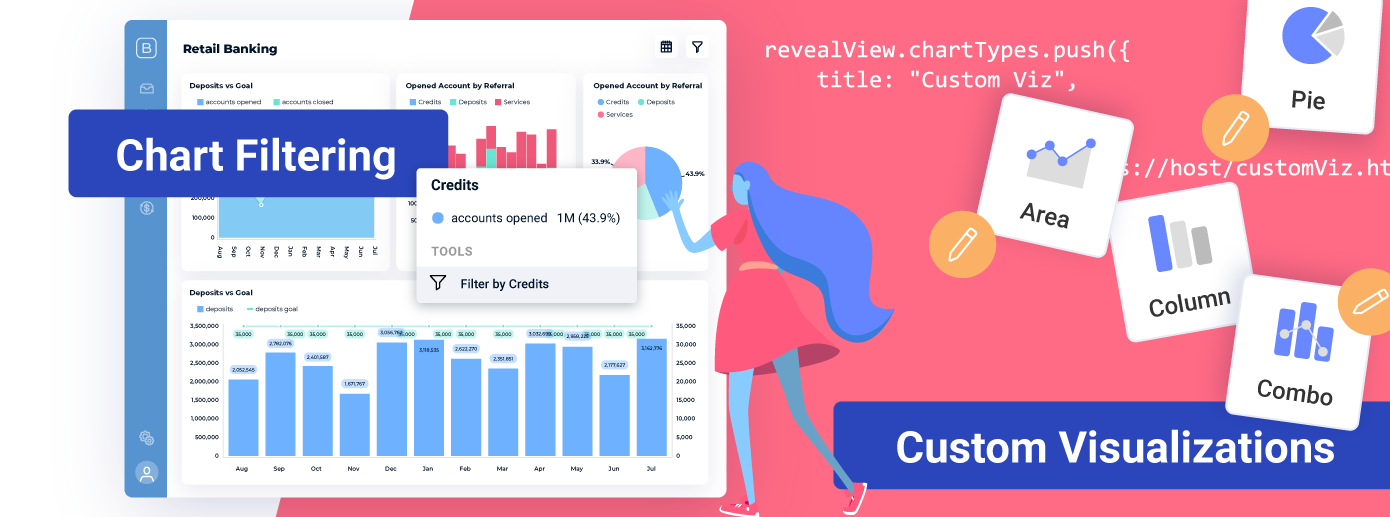
Introducing custom visualizations, interactive chart filtering and a host of other enhancements and bug fixes that help us provide you with the best embedded analytics solution you deserve.
Continue reading...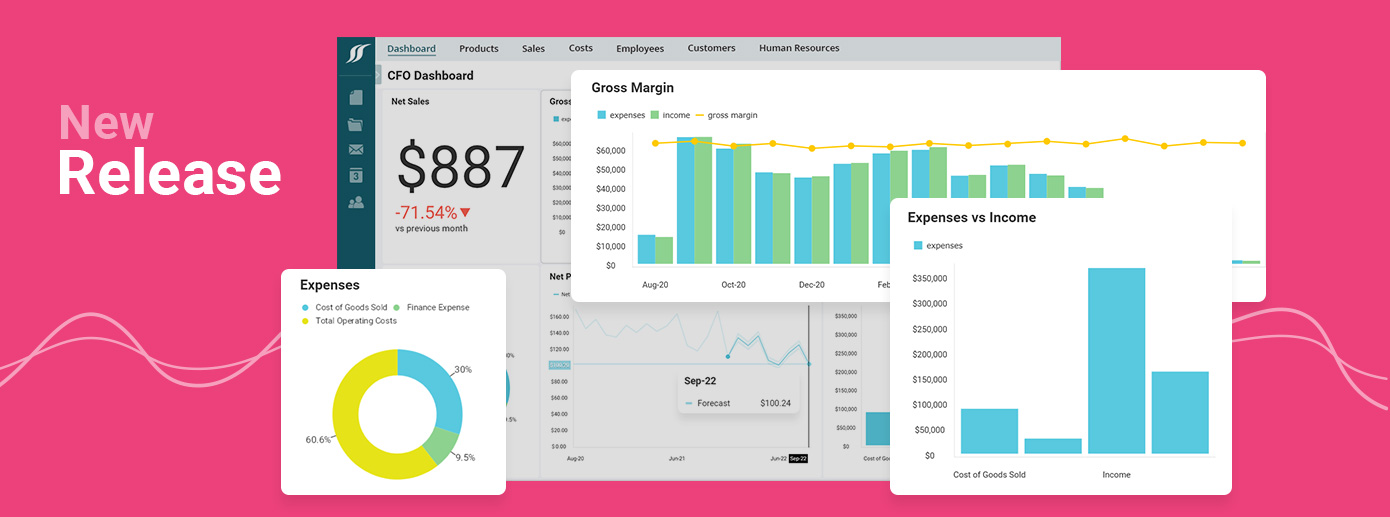
Today we are excited to deliver 15 new features & product enhancements to the Reveal visualization editor, API, data sources, and docs. Find out more!
Continue reading...
Reveal's goal is to deliver an amazing end-user UX for self-service BI, deep data analytics and data storytelling.
Continue reading...
Learn the 5 proven methods ISV and SaaS leaders use for data monetization. Discover the steps you need to take and the problems you may face.
Continue reading...Learn the 5 proven methods ISV and SaaS leaders use for data monetization. Discover the steps you need to take and the problems you may face.
Continue reading...
Find out what are the pros and cons of Tableau Embedded Analytics and identify whether it is the right analytics solution for your business needs.
Continue reading...
Find out what are the pros and cons of the Sisense embedded analytics platform and how it matches Reveal’s embedded analytics solution.
Continue reading...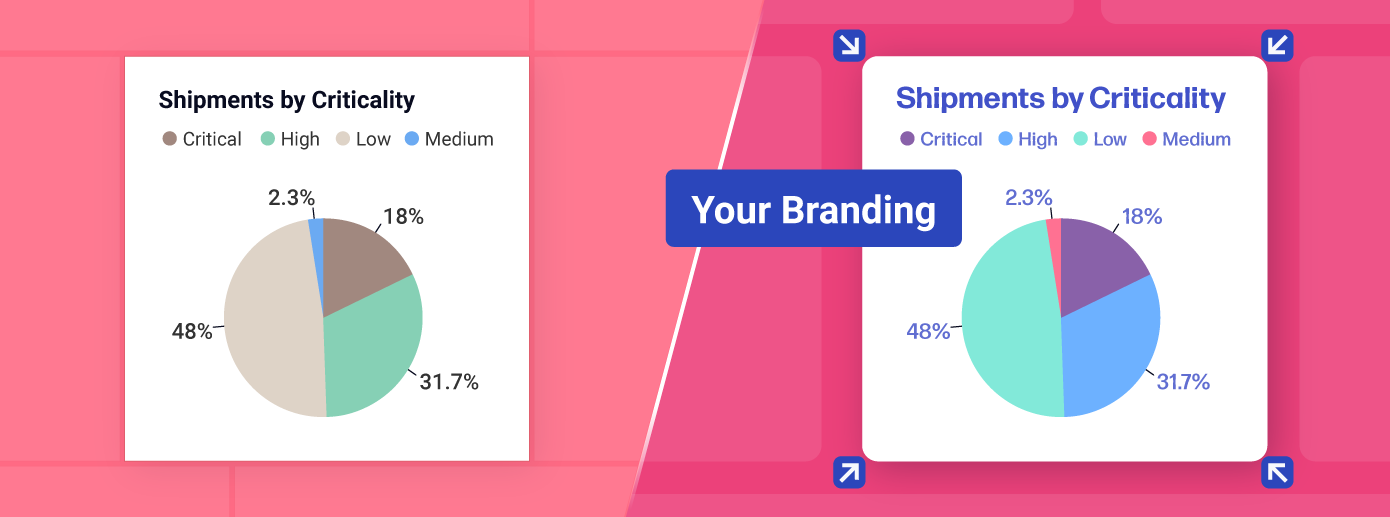
Delve into white label analytics, its benefits, and use cases and get expert guidance on selecting the ideal solution tailored to your requirements.
Continue reading...
Find out why most embedded analytics vendors keep their pricing hidden and how Reveal is an affordable BI vendor to help maximize your profits.
Continue reading...
A side-by-side comparison of the 12 best embedded analytics platforms. See how they rank based on the metrics that matter most for ISVs.
Continue reading...
What is Enterprise Resource Planning (ERP) and how does it work? Check the answers and why the ERP user experience is dramatically improved with embedded BI software.
Continue reading...
What is mobile business intelligence (BI) and why is it important? Learn why native SDKs let you share the most beautiful BI dashboards on your mobile devices.
Continue reading...
Modernize legacy apps with embedded analytics in app modernization. Improve UX, reduce tech debt, and scale faster.
Continue reading...
Find out what is data-driven decision making and why is important. Learn about the 7 building blocks for becoming a data-driven company + examples and video
Continue reading...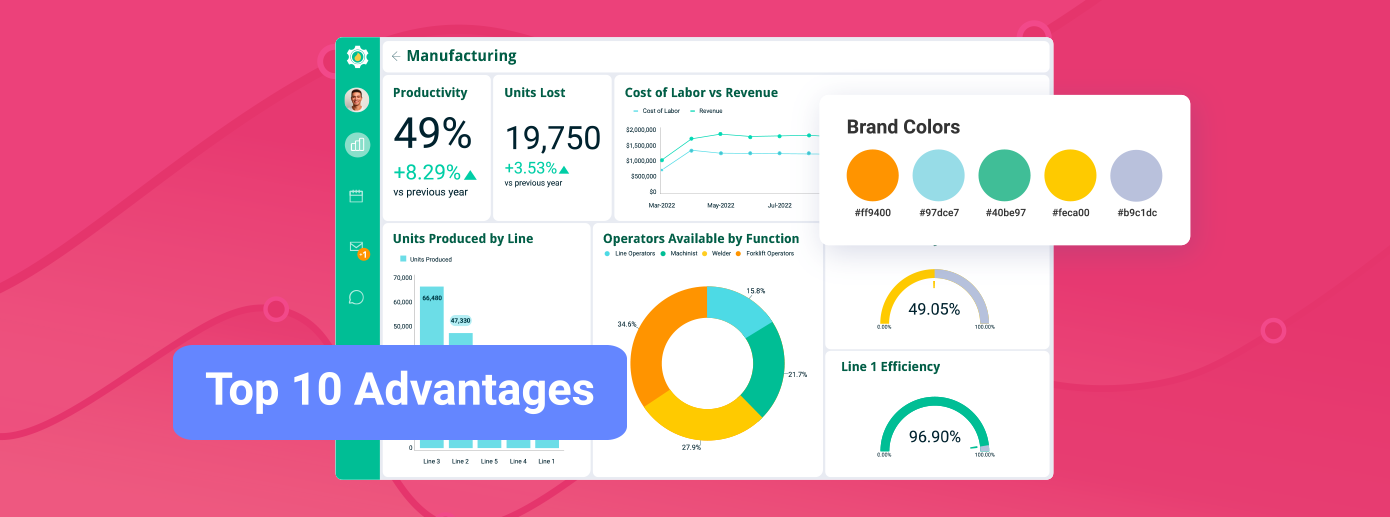
Learn how the top 10 embedded analytics benefits will enhance your decision making, streamline your workflow, and increase your product's value.
Continue reading...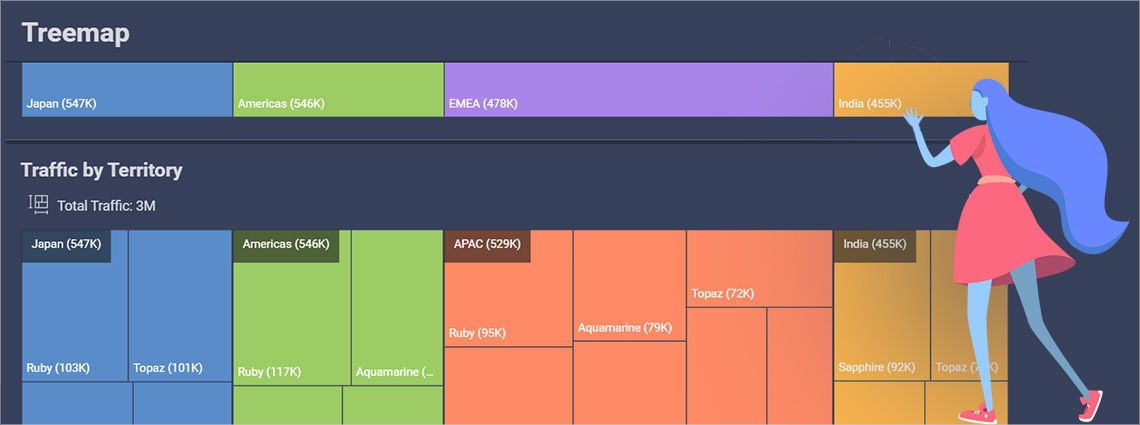
Treemap Chart Best Practices - Learn how to create Treemap Chart data visualizations using Reveal Embedded BI & Analytics.
Continue reading...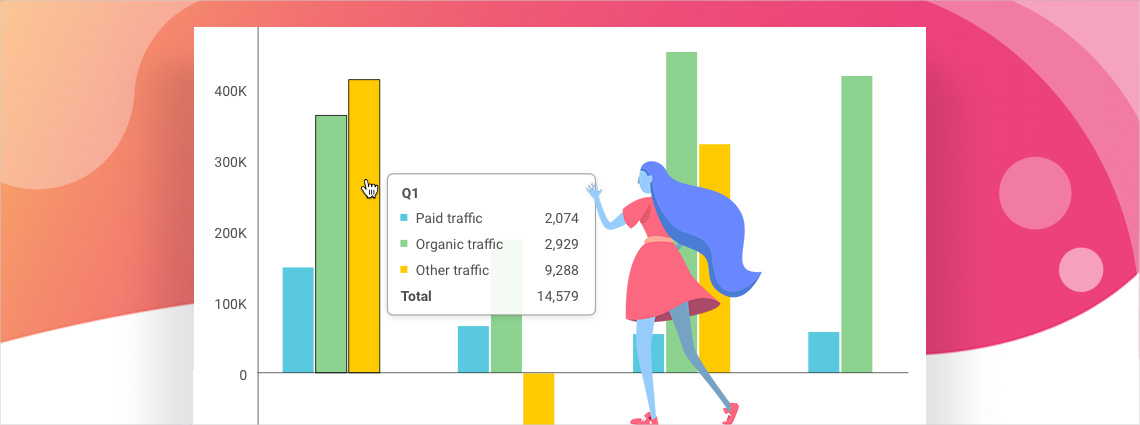
New features include additional flexibility in how to use Tooltips in visualizations, and theme updates to better match your application's look and feel.
Continue reading...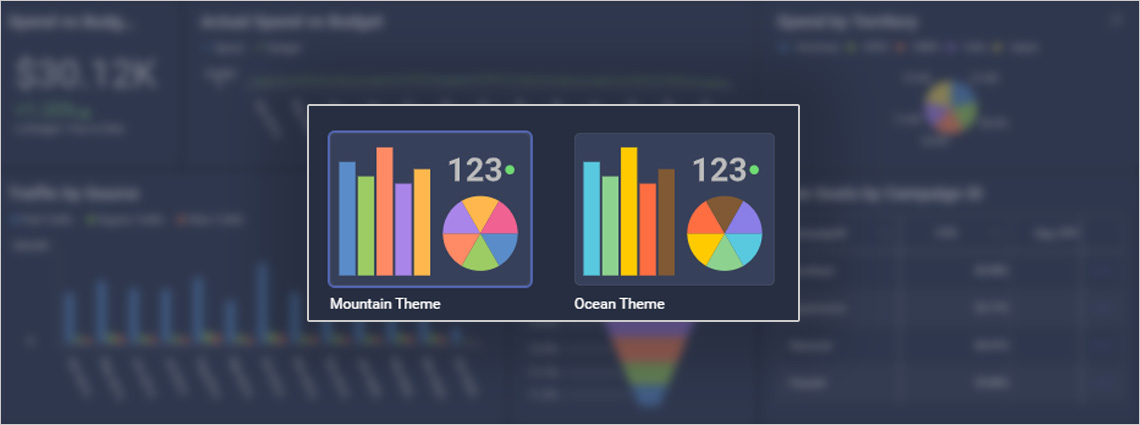
See how to apply custom theming to Reveal embedded BI software and create your own dashboard and visualization style to match your app's look and feel.
Continue reading...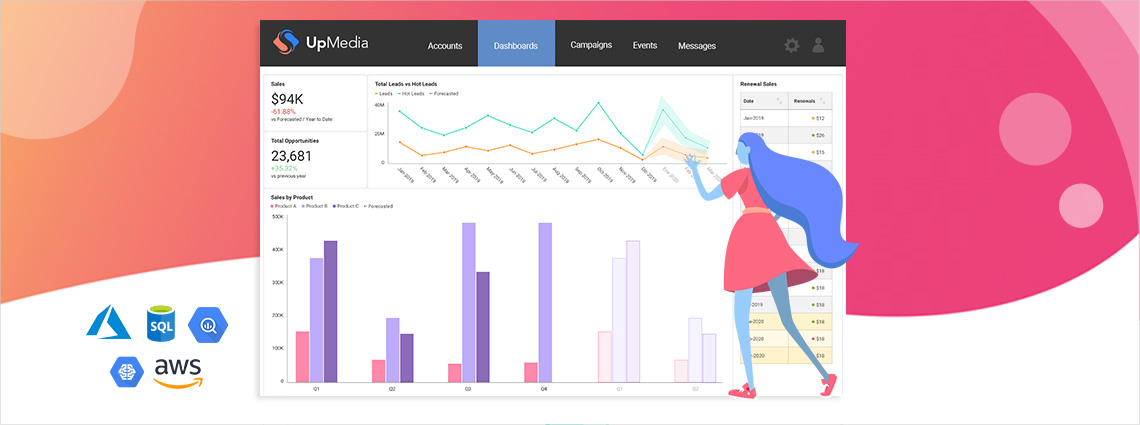
Experience the power of data analytics enhanced with machine learning, Big Data connectors, predictive analytics, R and Python scripting, and more.
Continue reading...Find out what is population pyramid chart and how to create one using stacked bar charts.
Continue reading...
In a recent podcast interview with SD Times, our Senior VP of Developer Tools, Jason Beres, talks about some of the key steps companies should consider as
Continue reading...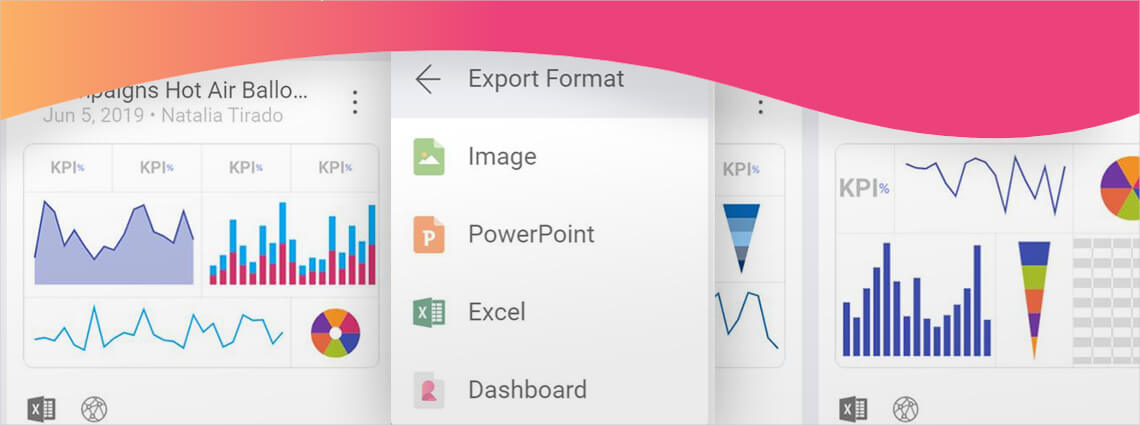
Enhance your embedded visualizations with the new combo charts with single or dual axis, work with a new modern UI, and export charts directly to Powerpoint or Excel.
Continue reading...
Use Reveal's in memory database feature to expand the number and types of data you can access from your app with embedded analytics.
Continue reading...
Learn how to secure your data with the Reveal embedded BI platform that includes multiple authentication methods, local caching of data, and much more.
Continue reading...
Learn how easy it is to create data-driven teams within Reveal's business intelligence platform. The simplicity brings beautiful visualizations to analytics.
Continue reading...
Interested in building your own KPI dashboard? Learn how to visualize your business metrics with this step-by-step walkthrough of Reveal BI software.
Continue reading...
Create beautiful data visualizations for your business dashboard with the Reveal visualization editor & our drag-and-drop interface with 30+ templates.
Continue reading...
Learn nine ways to improve your business data visualizations with Reveal's BI software. These quick tips help with overall readability & meaning of your charts.
Continue reading...
Embedded analytics are powerful for adding value and stickiness to your desktop and mobile apps, and buying analytics from a third-party vendor can be the most efficient way to take advantage of the data your apps generate.
Continue reading...
What is the better solution for your embedded analytics? Learn what are the trade-offs behind the embedded analytics build vs buy decision.
Continue reading...
The apps you create, whether for mobile or desktop, generate huge amounts of data, both from user input and information collected passively. If your app
Continue reading...
