Scriptly Helps Pharmacies Identify Trends in Real Time with Reveal

Explore the complete guide to embedded analytics, including architecture, security, AI capabilities, implementation patterns, and evaluation criteria for modern applications.
Read Now
Fully branded white label dashboards offer custom personalization so that your customers can present a holistic service that is all branded to one company.
Read Now Embedded analytics dashboards for SaaS & ISVs
Embed real-time, interactive dashboards your customers can explore — and build themselves — right inside your app. Fully branded, powered by a true SDK. No iFrames.

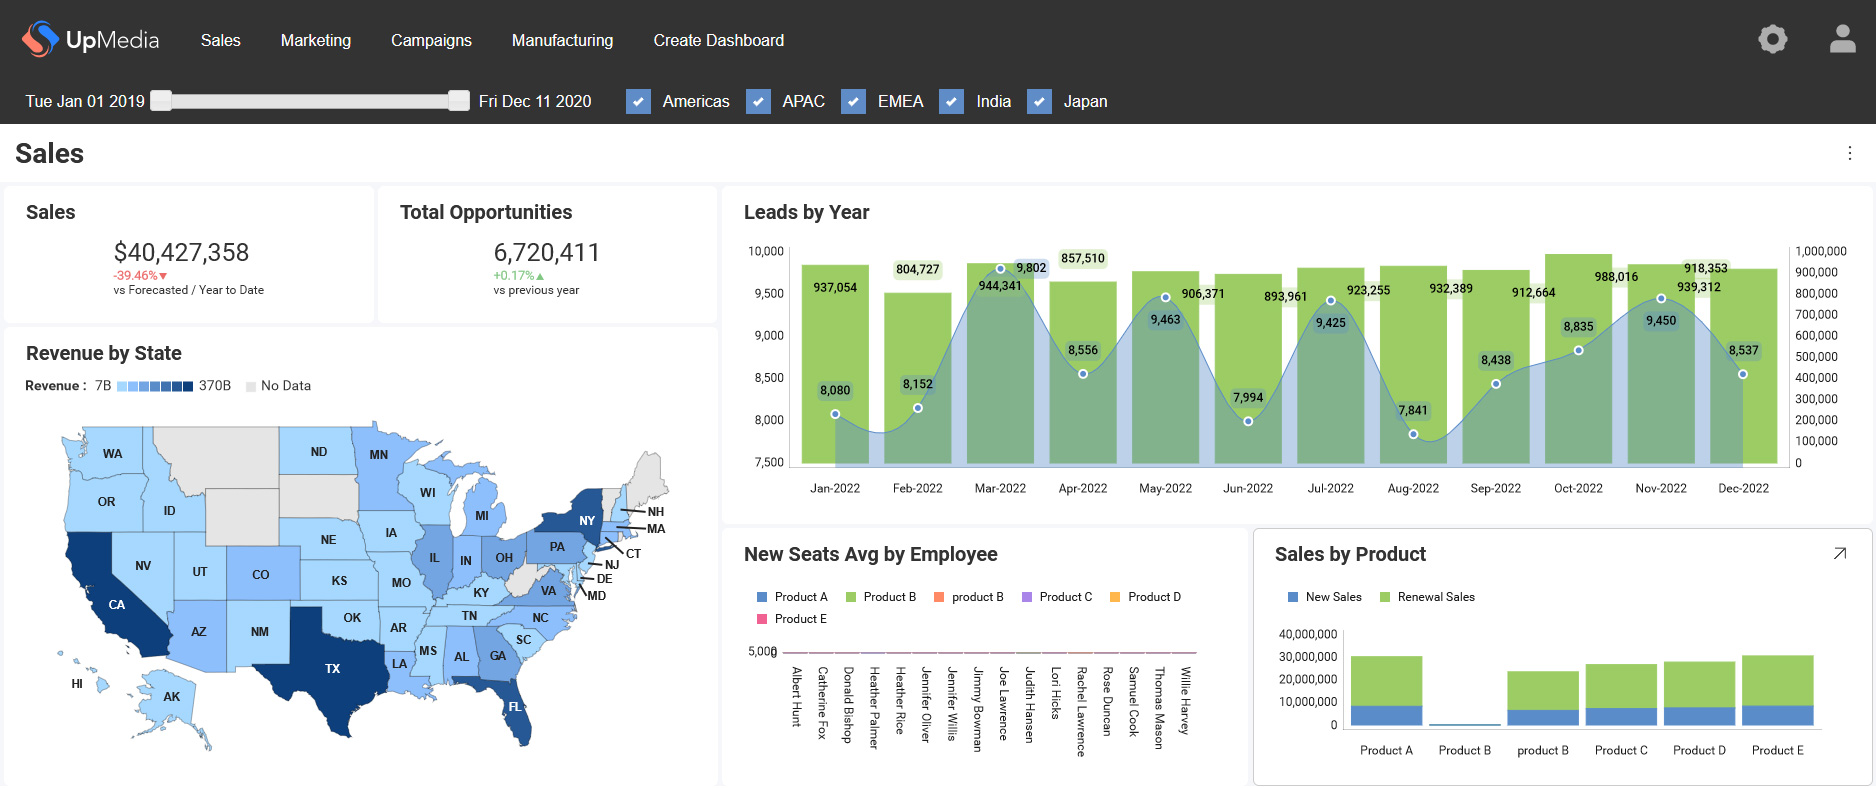
Embedded dashboards are interactive data visualizations — charts, KPIs, and reports — built directly into a software application, so users explore live data in the product they already use. Unlike a static report or a dashboard bolted on through an iFrame, an embedded dashboard is a native, interactive part of your app.
A report tells your users what happened last week. A dashboard lets them ask why, right now — filtering, drilling in, and following the data wherever the question leads. Embedding that experience means your customers get it without leaving your product, and you get it without building a visualization engine from scratch.
Reveal puts interactive dashboards inside your app with a true SDK. They render natively, match your brand, and run on live data — so the dashboard feels like a feature you built, not a tool you bolted on.

Linking Out vs. Embedding
Send users to a separate reporting tool and most of them won’t go. The context switch — another login, another interface, another export — is enough friction to kill the habit.
Every extra step is a reason to skip the report: a second login, an interface they have to learn, a file to export before anyone can look at it. The dashboard gets opened once, and the questions come back to your team instead.
 Another login and another interface to learn Nightly exports and static PDFs instead of live data Reporting stays a side tool, never a habit
 Dashboards that live inside your product get used, because they’re already where the work is. Filter a chart, drill into a spike, change the date range — and the answer updates in place, in the same session.
 Live data users filter and drill into themselves Answers in the workflow, where the decision happens No second login, no export step
Embedding also changes what “analytics” means for your product. Instead of a nightly export or a static PDF, your users get live data they can interact with. That’s the difference between reporting and a product feature people rely on.
The Platform
Build the dashboards your product needs — and let them grow with it.

Track live activity as it happens, inside the tools where decisions get made.

Summarize performance at a glance for the people who just need the headline.

Deep exploration — drill-downs, filters, and cross-chart interactions for users who want to dig.
Most embedded dashboards are just an iFrame in a web view — slow, hard to style, and obviously third-party. Reveal is different. A true SDK renders dashboards as part of your app, and full white-label control means you set the colors, fonts, and styling so they look built in-house.
You get complete control over your app experience: how dashboards are branded, which features to show or hide, how security works, and where you deploy.
Static charts answer one question. Reveal’s dashboards answer the next one too. Users drill from summary to detail, filter across charts, and explore live data connected straight to your sources — no overnight refresh, no exporting to a spreadsheet to dig deeper.
It’s dynamic data exploration built for the people using your product, not just analysts.

The Difference
A report is a snapshot. An embedded dashboard is a live surface your users act on. The gap shows the moment someone has a follow-up question.
| Capability | Static Report / Export | Interactive Embedded Dashboard |
|---|---|---|
| Data | A snapshot in time | Live and always current |
| Interaction | View-only | Drill down, filter, explore |
| Where it lives | A separate file or tool | Inside your product’s UI |
| Branding | Generic | Fully yours, white-labeled |
| Who creates it | Your team, on request | Your users, self-service |
For the broader BI capability — reporting, data exploration, and the build-vs-buy case — see embedded BI. For the full category, start with our embedded analytics guide.
Who It's For
Reveal is built for teams putting analytics in front of customers:

Adding dashboards and reporting so customers can see the value they’re getting — and stay.

Who need production-grade BI without pulling engineers off the core product.

Turning analytics into a premium, monetizable tier.
If you’re weighing how much BI to build around them, that’s the embedded BI question — this page is about the dashboards themselves.
Why Reveal
Reveal is built by Infragistics, with 30+ years of experience helping organizations put data to work. It’s SOC 2-certified and GDPR-compliant, and trusted by software companies serving millions of end users.
The proof of concept was running within hours, and most functionality worked out of the box. We estimated it would have taken nearly two years of development to build what Reveal gave us, so we put that time back into our core expertise: cost modeling.
 Jelmer de Jong Product Owner, CostPerform
 USED BY SOFTWARE COMPANIES DELIVERING EMBEDDED ANALYTICS WORLDWIDE.




Simple Pricing
Most embedded tools meter you — per user, per query, per dashboard. Grow, and the bill grows with you, unpredictably. Reveal is one fixed price: unlimited users, unlimited dashboards, on any device, with no tiers and no hidden fees. You keep the margin as you scale.
Get a Custom QuoteReveal is different:
Embedded dashboards put live, interactive data inside your product — no separate tool, no static exports.
Users can build and customize their own, with no tickets to your team.
A true SDK, not an iFrame: native rendering, full white-label, real interactivity.
One fixed price — unlimited users and dashboards.


Book a personalized demo and we’ll show interactive dashboards running against your use case — or start a free trial and embed one yourself.