Explore the complete guide to embedded analytics, including architecture, security, AI capabilities, implementation patterns, and evaluation criteria for modern applications.
White-Label Software and Analytics: Enhancing Your Brand
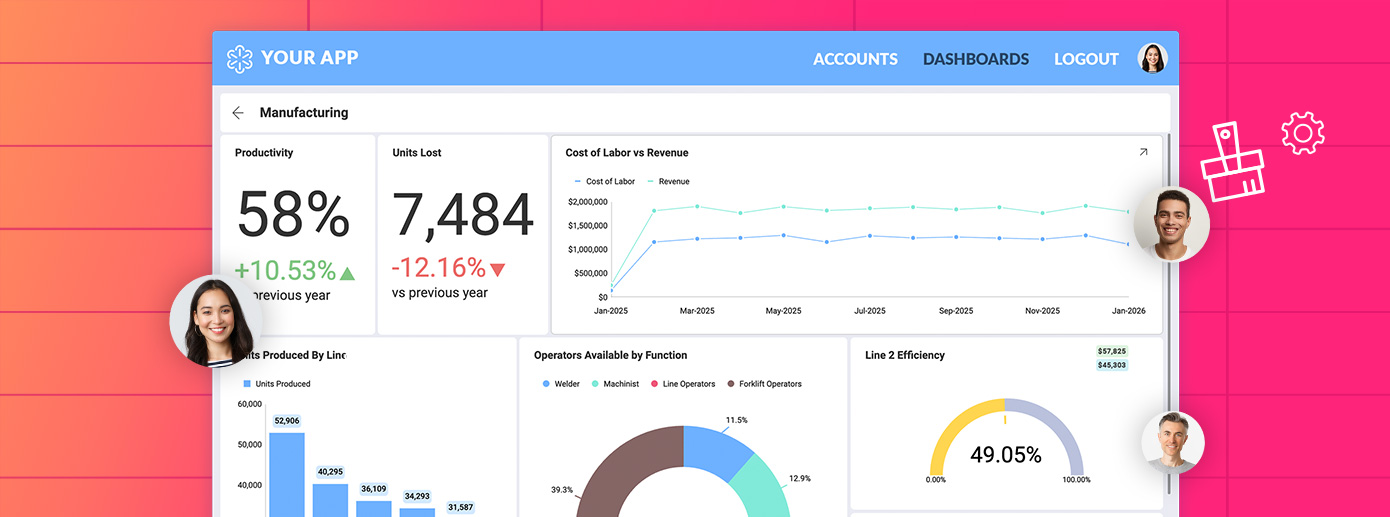
Fully branded white label dashboards offer custom personalization so that your customers can present a holistic service that is all branded to one company.
Best Practices for Creating Compelling Visualizations
What Makes Visualizations Impactful?
We’re all bombarded with information and content, and it’s often overwhelming. So how do you quickly separate the important data from the noise? And how do you shape it into a compelling data story for your customers, executives, or partners?
Choosing the right visualization—chart or graph—for the story you want to tell is imperative.
In this paper, we present the top 10 best practices to help you create impactful visualizations, including:
Understand the User First
Choose the Right Chart Type
Make Proper Use of Color and Text
Avoid Chart Junk
Be Clear with Your Data
Highlight What’s Important
Use Effective Interactions
Use 3D Wisely
Pay Attention to the Details
Use the Right Scale
We also show how newer, modern analytics platforms help you combine visualizations into powerful dashboards—dashboards that are intuitive, combine data from multiple sources, and let users quickly drill down to the specific information they want.
Data visualization refers to a chart or a graphical representation of data in which the data is represented by symbols, such as bars in a bar chart, lines in a line chart, or slices in a pie chart. Chart and data visualization can be used interchangeably.
Data visualizations can either stand alone as single visualizations or they can be combined with multiple charts to create dashboards
Why Following Data Visualization Best Practices Matters
As consumers or businesses contend with the explosion of more complex information, we need to help them understand it faster.
As you can see, data visualizations help make data more consumable, help users make decisions, and tell a story.
Charts take rich data (often KPIs) and make it consumable
Multiple charts make up dashboards that display one or more visualizations to help users make decisions
Charts can tell a story in an explanatory way or exploratory way
We, as humans, are programmed to think visually
65% of people are visual learners i
We process images 60,000 times faster than text ii
It takes 13 milliseconds to recognize an image
Even something as simple as looking at heights by person, like the chart below, makes it clear how sorting this data in the column chart gives you immediate insights.
So, when creating visualizations, it is best to make sure you are following best practices as highlighted throughout the rest of this paper.
The golden rule of communication is to know your audience. You will communicate differently to a technical user than to a business user or if you are making a sales pitch to a client or a presentation to your company’s executives.
Every visualization is telling a data story. Your job as the person designing the story is to:
Have clarity on the story your data is going to tell
Know your audience and their goals
So, when creating your visualizations, keep in mind these questions when making sure your visualizations simplify complex data, tell your data story and drive decision-making:
Simplify Complex Data:
Who will be using the visualization?
Do you know your audience?
What questions should this visualization answer?
Tell Your Data Story:
Do you need a single visualization or multiple visualizations?
Does the Chart Title give enough context to the data, or do you need supporting Text to tell the story?
Drive Decision Making
What techniques can you use to highlight important points in your data story?
Is this an exploratory visualization or an explanatory visualization?
One of the biggest struggles when it comes to telling an effective story with your data can be picking out the right chart type. There is an infinite amount, and each has unique attributes that can help you best get your message or data story across. While your data could work with multiple charts, it is up to you as the creator to ensure you are selecting one that makes the data clear and concise for the consumer.
To help in this process, think of these key questions when you are choosing each visualization for your data and use the guide below to help you:
What is the key point you want to communicate with your chart?
Do you want to compare variables?
Do you need to understand the distribution of the data?
Are there possible trends you need to analyze?
Choose the point you want to make and select a chart type that is optimal.
Color and Text can help highlight what’s important, or they can derail your data story. Use color to communicate effectively based on your data, not beauty or “chart art.”
When looking at this chart:
The colors are too similar to be able to quickly distinguish between the different fields
There is a poor use of fonts. Serif fonts are great for reading on paper but not onscreen
3D makes it difficult to tell the part size to the whole
The labels on the pie chart are almost impossible to read.
To avoid chart confusion and derailing from your story, there are three types of color schemes you can use on your charts – diverging, sequential and categorical.
Follow the guidelines below when choosing the right colors for your charts:
Use diverging color schemes when a central value is shared between both ends
Use sequential colors with numeric or ordered values
Use categorical colors with distinct variables without any order
Focus your visualization on the data story and keep the chart clean and easy to read. Don’t confuse the user with unnecessary information or graphics such as:
3D, disruptive shading
Heavy grid lines/boxing borders
Whimsical font choices
Distracting background imagery
A large share of ink on a graphic should present data information. Data-ink is the non-erasable core of a graphic, the non-redundant ink arranged in response to variation in the numbers represented.
Above all else show the data.
Edward Tufte, The Visual Display of Quantitative Data, 1983
Taking a look at the chart below, there is so much going on that takes away from the purpose of the chart itself:
When you remove the junk from the visualization it makes the story of this chart a lot clearer:
Use visualization features to create clarity in your data story. Tell a story of growth by sorting your data in ascending order. To show falling growth or revenues, use a descending sort.
Chart features like titles, trendlines, or crosshairs can help you more quickly tell your story. Follow these six best practices to ensure your data visualizations are clear:
Chart Titles and Descriptions
Use descriptive and concise Titles that give the consumer reason and explanation for your chart. Keep your chart title simple and to the point since your data and visualization should tell the core of your story. Primarily, your title should directly relate to and support the chart underneath it. For example, in the chart below, let the legends and your visuals tell the story for the Division and Age, but give the consumer enough concise information for what they are gathering from this chart.
Alphabetical Sorting
Sort your data alphabetically when you are using categories on your x-axis, and you need to help people find what they are looking for quickly.
Sort Data in Ascending Order
Sort your data in ascending order when you need to help tell the story of growth.
Sort Data in Descending Order
Sort your data in descending order when you need to compare largest to smallest.
Trendlines
Trend lines are a powerful technique in a time series chart, and we’re seeing these more and more in the popular media. NY Governor Andrew Cuomo often used a 7-day average trend line for the rate of Coronavirus increase or decrease to eliminate outlier days. Where daily variations might make comprehension more difficult, a time series trend line reveals the general direction of the data over time.
Cross Hairs
Using cross hairs helps give viewers more details while analyzing your charts. Not every chart calls for cross hairs, but you can see in the chart below how they help the user gain clear insights into the exact data points:
Design visualizations to focus the user on the most important thing about your data story. Highlighting key points, trends, and bounds within your data can be key to providing your end users with the quick insights they need.
Use these key features when looking to highlight important data:
Series Highlighting
Focus the user’s attention on what you want them to look at by using series highlighting.
Conditional Formatting
Bring attention to key data points with conditional formatting. Set bounds that correlate to variations in your data.
Chart Annotations
With chart annotations, you can support your storytelling on a chart or with collaboration. Annotations provide your consumer with insights deeper than data points.
Outlier Detection
Outlier Detection allows you to quickly highlight anomalies or deviations in a data set.
Time Series
Time Series Forecasting allows you to make predictions for future data points based on past and present data giving your consumers predictive analytics.
Linear Regression
Linear Regression allows you to plot trends between dependent and independent variables. Use this when you want to show the “best fit” line to match (predict) the general trend in the data
Modern data analytics programs make it easy to create interactions to allow users to slice and dice data to gain deeper insights into the questions they are looking to answer.
Some of the most effective interaction includes:
Dynamic Filtering
Adding filters to your dashboard or visualization allows you to pivot your data on the fly to gain deeper insights. Provide either at the dashboard level or visualization level different options for your viewers to slice and dice data either by category fields or date ranges.
Drill-Down
When you enable hierarchies within your category or date fields, it allows your end users to do deeper analysis. For example, in the following visualization, you can drill down from your different marketing channels into the specific product to gain another level of insight about what awareness you are driving:
Treemap
Treemaps are excellent visualizations for drill-downs. They display large amounts of hierarchical data in a compact space at a glance and show data as part of a whole. You can see the relation of one country’s budget to all the others, and with a drill down, a user can quickly perform a deeper analysis.
Dashboard Linking
Take drill down to a new level when you can link data points or visualizations to other dashboards. In the example below, you can set up an overview marketing dashboard that presents ongoing marketing campaign results. With a dashboard link, you can set up a link between that dashboard and a more detailed one about each of the campaigns you are running.
Use images and text fields to create landing pages or right from within dashboards to link as well:
3D obfuscates real data, creating room for assumption vs. analysis.
3D visualizations have a place if you are doing surface analysis, volatility analysis, or terrain research. This chart works because it shows temperature variations in a volcano from top to bottom with multiple axis including X, Y, and Z, and it tells a more useful story in 3d space.
It is a best practice to avoid 3D for standard business use. For example, in the two charts below the left is almost impossible to read, understand and gain any insights from. The chart on the right, showing the same data, is much clearer. From a quick glance, I can see that the Hawaiian Club consistently outperformed the other two resorts in revenues from 1993 to 1995.
Sometimes details can enhance your data story, but other times excessive detail confuses your message. Keeping your numbers formatted or filtering out top results to data is readable
Formatting your data can be a quick, simple way to make the numbers more visually appealing and easier for an end user to read. For either gauges or charts such as bar charts and column charts, you can adjust your data formatting to make your data point stand out: limiting the number of decimals, for example, or adjusting the placement of comma separators. Also, consider using currency or, percentage measurements, or large number formatting.
Compare the two different KPIs below. Which is easier to immediately understand?
There are 3 types of lies: lies, damn lies and statistics.
Mark Twain
Misleading visualizations can be found everywhere. We see it too often in the news, boardrooms, and on social media: charts that deceive. Sometimes it’s unintentional, but other times it’s intentional.
The best way to avoid being guilty of misleading visualizations is to steer clear of changing the scale of the Y-Axis. This tends to tell a different story than the data should.
Here’s just one example of how a chart tells an incorrect story. Both charts are showing the same data. However, the right chart has the axis starting at 5%, making it look like the US GDP is plummeting. Whereas when you look at the left chart there is in fact only a small gradual decline.
Conclusion
The 10 best practices in this whitepaper should provide valuable tips on creating eye-catching and highly effective visualizations. Businesses are adopting greater use of data in order to better spot trends or see new opportunities. With data visualizations and dashboards, you can tell a strong story or use it for exploration to gather insights and feedback from your team.
Casey Ciniello is a data and analytics-focused product leader at Infragistics, where she drives strategy and innovation for the Reveal embedded analytics platform and the Slingshot work management solution. With a BA in mathematics and an MBA, she brings an in-depth analytical foundation and business perspective to building products that help organizations turn complex data into actionable insights.
Casey leads the development of analytics-driven capabilities, shaping product direction through deep market analysis, user behavior insights, and evolving business intelligence trends. She works closely with customers to understand how data is used in real-world decision-making and translates those needs into intuitive, high-impact analytics experiences. Casey also serves as the Survey Lead for the annual Reveal Software Development Challenges survey, where she analyzes industry data to uncover key trends in analytics, AI, and modern development practices. Her insights and thought leadership have been featured in Dataversity, RT Insights, SaaSXtra, SD Times, Solutions Review, TechStrong IT, App Developer Magazine, Beta News, Integration Developer News, and UX Planet. She is a frequent webinar presenter on modern embedded analytics, machine learning, data visualizations, and scaling SaaS analytics. Casey joined Infragistics in 2013.
Your Privacy Matters:We use our own and third-party cookies to improve your experience on our website. By continuing to use the website, we understand that you accept their use.Cookie Policy.
We use our own and third-party cookies to improve your experience on our website. They also allow us to analyze user behavior in order to constantly improve the website for you. Please review our Cookie Policy and cookie settings below.
When you visit any website, it may store or retrieve information on your browser, mostly in the form of cookies. This information might be about you, your preferences, or your device and is mostly used to make the site work as you expect it to. The information does not usually directly identify you, but can give you a more personalized web experience. Because we respect your right to privacy, you can choose not to allow some types of cookies. However, blocking some types of cookies may impact your experience of the site and the services we are able to offer.
Your Privacy Matters: We use our own and third-party cookies to improve your experience on our website. By continuing to use the website, we understand that you accept their use. Cookie Policy.